Phase Diagram Worksheets PDF for Grade 10
These phase diagram worksheets pdf for 10th grade give chemistry and physics teachers a set of pressure-temperature graph exercises built around the reading tasks students actually find difficult: locating the triple and critical points with accuracy, tracing phase paths at constant pressure or constant temperature, and explaining what the slope of the fusion curve says about a substance's density. The resources move from region labeling through to path analysis and substance comparison, following the same internal progression most teachers use when building a unit on states of matter.
What Students Work Through in Each Worksheet
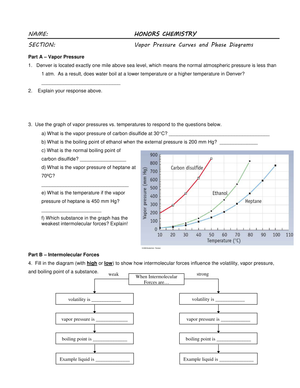
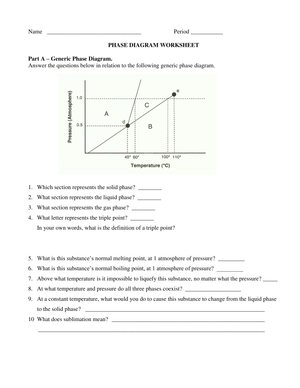
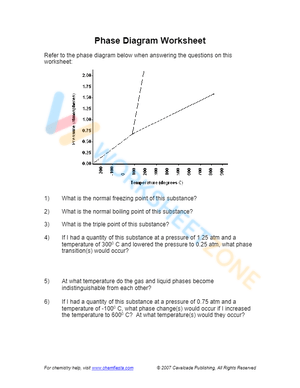
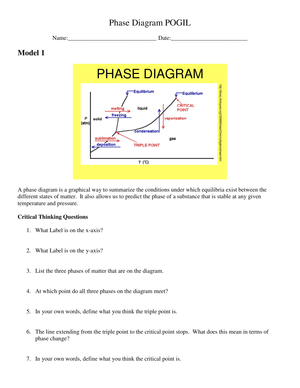
The central demand built into these phase diagram worksheets pdf for 10th grade is treating the P-T graph as a coordinate system — not just a picture to label, but a tool for extracting specific physical information. Students mark the solid, liquid, and gas regions, locate the triple point and critical point, and write brief explanations of each. That last step is where the real conceptual work happens: distinguishing the triple point (three-phase coexistence at one specific set of conditions) from the critical point (where the liquid-gas distinction disappears entirely) requires precision in both reading and vocabulary.
Later worksheets add more demanding tasks. Students draw a horizontal line at 1 atm to identify the normal melting and boiling points — a technique that also explains, in passing, why water boils below 100 °C at high altitude. They interpret the slope of the solid-liquid boundary as a signal about relative density: a fusion curve that tilts left tells you the liquid is denser than the solid, as in water; a curve that tilts right tells you the opposite. Path analysis problems ask students to trace a route across the diagram at fixed pressure or temperature and identify each phase change along the way.
- Labeling solid, liquid, and gas regions with correct orientation on the P-T axes
- Identifying the triple point and critical point and explaining what each represents
- Extracting normal melting and boiling points from the 1 atm pressure line
- Interpreting fusion curve slope as a density relationship between solid and liquid phases
- Tracing constant-pressure and constant-temperature paths across phase boundaries
- Comparing the phase diagrams of water and carbon dioxide, including the placement of each substance's triple point relative to 1 atm
Errors That Show Up Consistently in Student Work
Path analysis produces the most revealing errors in this unit. When asked to describe what happens to CO2 heated from −100 °C to 20 °C at a constant pressure of 5 atm, most students draw a diagonal line across the diagram rather than a horizontal one. They haven't internalized that "constant pressure" pins the path to a single horizontal track — the point moves left to right with no vertical component at all. Having students circle the path before they write anything catches this error before it becomes a committed written response.
A second error runs deeper. Students who correctly locate the triple point on a water diagram will assume, when shown the CO2 diagram, that dry ice must also have a liquid phase at room pressure. They pattern-match from the water layout instead of reading the axis values. CO2's triple point sits at approximately 5.1 atm — well above standard atmospheric pressure — and that positioning is exactly why CO2 sublimates rather than melts under normal conditions. The comparison exercises in the set surface this assumption directly and give students a concrete reason to read the numbers on each axis rather than rely on memory of what the water diagram looks like.
The supercritical region generates its own category of error. Many students describe a supercritical fluid as "very hot gas," reading the region as simply past the boiling line. They miss the structural detail: the liquid-gas boundary does not continue beyond the critical point — it ends. Asking students to trace that equilibrium line with a finger until it stops, then mark where the line terminates rather than where it curves, makes the critical point's meaning concrete rather than definitional.
Building These Worksheets Into Your Unit Sequence
The first labeling worksheet belongs right after the introductory lecture on states of matter and before any quantitative phase-change work. Students need a low-stakes pass at reading a P-T graph before they are asked to extract numbers from one. Running it as a whole-class activity with the diagram projected on the board — talking through the regions and axes together — reduces the disorientation that comes with the unfamiliar shape of the graph and its non-intuitive orientation.
Phase diagram worksheets pdf for 10th grade slot naturally into three moments across a unit: as a post-lecture check after introducing P-T graphs, as guided practice during a lab where students compare theoretical diagrams to PhET simulation data, and as a formative assessment at the end of a states-of-matter sequence before any summative work. The path-analysis problems fit especially well in the last five to eight minutes of class — a bounded task with a clear stopping point that works with the rhythm of the period rather than against it.
The Water-Carbon Dioxide Comparison
Most substances have a solid-liquid boundary that tilts upward and to the right: higher pressure favors the solid phase, and the curve moves in the direction of lower temperature as pressure increases. Water is the exception. Its fusion curve tilts upward and to the left — applying pressure to ice lowers its melting point because the liquid is denser than the solid, and pressure drives the system toward the denser phase. Students who understand this reasoning can explain why ice floats without memorizing a rule, connecting the shape of a single line on the graph to a molecular-level density argument.
Carbon dioxide offers the starkest contrast in the comparison exercises. At 1 atm, CO2 has no liquid phase at all — a horizontal line drawn at 1 atm passes directly from the solid region into the gas region without touching the liquid area. CO2's triple point sits at approximately 5.1 atm and −56.6 °C, meaning any pressure below that value leads to sublimation rather than melting. Students who understand the triple point's position on the diagram can explain dry ice behavior from the graph rather than from a memorized fact.
Standard Alignment
These worksheets align to NGSS HS-PS1-3, which asks students to plan and conduct investigations gathering evidence for the relationship between intermolecular forces and the macroscopic properties of substances. Reading a phase diagram addresses the macroscopic side of that standard directly: students identify conditions of temperature and pressure under which a given phase is stable, which reflects the balance of intermolecular forces and kinetic energy underlying each state. This standard typically appears in a 10th-grade chemistry or integrated science course during a states-of-matter or thermodynamics unit, most often in the first semester.
Adjusting the Set for a Range of Learners
For students still building graph-reading fluency, the labeling worksheets work best when the phase regions are pre-shaded and the task is narrowed to naming them, marking the key points, and writing short definitions. Removing the burden of interpreting a blank graph lets those students concentrate on the conceptual vocabulary — triple point, critical point, sublimation — without getting stranded on axis mechanics. Once the vocabulary is secure, reintroduce the axis-reading tasks on subsequent worksheets.
These phase diagram worksheets pdf for 10th grade span enough complexity that the same set serves developing and advanced learners without requiring separate materials. Advanced students benefit most from the open-ended path analysis problems and the comparative substance tasks — particularly problems that ask them to predict the slope of an unfamiliar substance's fusion curve from density data alone, then verify by checking the diagram. That predict-then-check routine builds genuine interpretive skill rather than practiced guessing.
Frequently Asked Questions
Are these worksheets appropriate for chemistry as well as physics?
Yes. Phase diagrams appear in both disciplines at the 10th-grade level. Chemistry courses typically encounter them in a unit on intermolecular forces and states of matter; physics courses more often approach them through thermodynamics. The comparative exercises on water and CO2 connect particularly well to chemistry content about hydrogen bonding and why ice is less dense than liquid water.
How long do the path-analysis problems take to complete?
The labeling worksheets run about 10 to 15 minutes for most students. Path-analysis problems take closer to 20 minutes because students who are uncertain about the graph tend to restart before committing to a traced path. Building in a brief peer-comparison step — students compare their traced paths with a partner before writing explanations — reduces that restart behavior and surfaces errors worth addressing with the whole class.
Can these worksheets go home as homework, or do they work better with in-class support?
The labeling and identification worksheets make reasonable homework once students have seen a P-T graph in class. Path-analysis worksheets are better used during supervised practice. The diagonal-path error is common enough that students working independently often complete the task incorrectly, arrive the next day with the misconception reinforced, and require more correction than if the error had been caught during class. If path analysis goes home, build a whole-class error-check into the opening of the following lesson.
What prior knowledge do students need before beginning?
Students should have a basic working definition of the three states of matter and be able to name the transitions between them — melting, freezing, boiling, condensation, sublimation, deposition — before starting the labeling exercises. They do not need prior exposure to P-T graphs; the labeling worksheets introduce that format. Students who cannot yet reliably distinguish melting from sublimation at the vocabulary level will struggle with the boundary-labeling tasks, so a five-minute vocabulary check before the first worksheet is worth the time.
Clear All