These 10th grade potential energy diagram printable worksheets give physics teachers a set of skill-specific practice resources for one of the most consistently misread tools in introductory mechanics. Each worksheet targets a discrete skill — labeling energy curves, reading kinetic energy as the gap between the PE curve and the total energy line, calculating stored and kinetic energy at specific positions — so teachers can assign them deliberately rather than handing out undifferentiated review. Students who struggle with energy problems almost always struggle with the diagram before algebra even enters the picture, and these resources address that directly.
Skills Each Worksheet Targets
The set moves through a clear progression. Opening worksheets ask students to label a pre-drawn energy curve: identifying where potential energy peaks, marking where kinetic energy is greatest, and locating the horizontal line representing total mechanical energy. At this stage students do not touch a formula — the goal is fluent reading of the diagram, which most curricula rush past too quickly.
Subsequent worksheets introduce numbers. Students calculate gravitational potential energy using PE = mgh, then apply conservation of energy to determine kinetic energy at lower positions and solve for velocity using v = √(2KE/m). The later worksheets bring in friction, asking students to calculate thermal energy dissipated and explain why total mechanical energy is lower at the end of the path than at the start. Scenarios include roller coaster tracks, half-pipe ramps, pendulums, and spring-mass systems — contexts students recognize without needing a lab setup to picture them.
Frequent Errors Teachers Should Watch For and Address
The most persistent mistake is also the most predictable: students read the potential energy curve as a literal picture of the track. A roller coaster problem that peaks at 30 meters produces a PE curve that peaks at the corresponding x-axis position — and students describe the graph as showing "the hill" rather than "the energy stored at that height." Asking students to sketch the physical scenario directly below the x-axis, vertically aligned with the energy curve, breaks this misconception faster than re-explanation does.
A second error surfaces in velocity calculations. Students correctly find KE = 60 J at the lowest point of the track, then report velocity as 60 m/s — skipping the step of solving v = √(2 × 60 / m). They treat the intermediate numerical result as the final answer. A simple unit-check habit — asking whether the answer carries units of m/s — catches this before it becomes entrenched. Writing the formula as v = √(2KE/m) explicitly on the worksheet also helps, at least until students have solved enough problems that the algebraic step is automatic.
Third: students draw total mechanical energy as a curve that mirrors or parallels the PE line rather than staying flat and horizontal. This reflects genuine uncertainty about whether the sum of PE and KE is truly constant. Color-coding — one color for the PE curve, a contrasting color for the total energy line — makes the flat-line constraint more memorable than any written definition.
How to Work These Worksheets Into Your Lesson Plans Effectively
The strongest entry point is the class period following a PhET Energy Skate Park simulation session. Students have already watched the PE curve shift in real time as they dragged the skater up and down the ramp. The worksheet the next day asks them to reconstruct those observations in static notation — draw the PE curve for a specific track height, identify where KE is greatest, mark total energy. The simulation gave them the experience; the worksheet makes it transferable.
For teachers running a gradual-release model, leading with the conceptual labeling worksheets before any formulas appear keeps the initial cognitive load manageable. Introduce PE = mgh and KE = ½mv² only after students can describe a diagram fluently without numbers. This sequencing prevents the common situation where students reach for a calculator before they understand what they are calculating. The quantitative worksheets then feel like a natural extension of what students already know how to read, rather than a sudden gear shift.
The worksheets also serve as tight bell-ringers the morning before a unit assessment — one scenario, one diagram, retrieval practice on skills already taught. Ten minutes of that kind of low-stakes review surfaces student gaps more quickly than any last-minute re-teaching session.
Standard Alignment
The 10th grade potential energy diagram printable worksheets in this set align with NGSS HS-PS3-1, which requires students to create computational models that calculate changes in the energy of components within a system as the system changes. Calculating PE and KE values at specific positions on a diagram is precisely that kind of computational modeling — students are not only reading a visual but using mathematical relationships to verify and predict what the diagram shows. The associated cross-cutting concept, energy and matter flows, maps directly onto the central task of tracking how energy redistributes between stored and kinetic forms. In most physics-first or integrated science courses, HS-PS3-1 lands in the second semester of 10th grade, which is exactly when these worksheets function best as formative practice before summative assessment.
Adjusting the Work for Different Levels of Physics Readiness
Students who are not yet fluent with the algebra can work through the early labeling worksheets as standalone practice — no calculation required. Teachers can extend that phase by providing both the total energy value and the PE value at a given position, so students determine KE by subtraction only. That removes the formula barrier while still building the conceptual core. Most of these students need one more full cycle with visual models before numbers make sense in context.
On-grade students follow the standard progression: labeling, then PE and KE calculations, then conservation problems that solve for velocity. Advanced students receive the friction worksheets and are asked to calculate thermal energy lost and explain the practical difference between an ideal and a real system. A strong extension for students enrolled concurrently in chemistry is comparing a mechanical PE diagram to a reaction coordinate diagram — the visual similarity between the two causes genuine confusion, and raising the distinction in physics class before chemistry introduces activation energy is time well spent. 10th grade potential energy diagram printable worksheets that include this cross-disciplinary prompt catch a misconception that otherwise tends to persist well past the unit.
Frequently Asked Questions
What scenarios appear across the worksheets?
Roller coaster tracks, pendulums, skate park half-pipes, and spring-mass systems. Roller coasters and pendulums address gravitational potential energy; the spring problems introduce elastic PE and demonstrate that the same conservation law applies regardless of what is storing the energy. All scenarios are familiar enough that students spend their mental energy on the physics, not on decoding an unfamiliar context.
How should I introduce the total energy line before students open the first worksheet?
Draw a PE curve on the board and ask where the "missing energy" goes when PE is low. Most students will say kinetic energy, which is correct — but they imagine it as energy that disappears and reappears rather than a fixed total being redistributed. Drawing the horizontal total energy line and explicitly labeling the gap at each position as KE takes about five minutes of class time. Students who see that model on the board carry a working mental picture into the worksheet instead of constructing one mid-problem.
Do the worksheets address non-conservative forces, or only frictionless systems?
The 10th grade potential energy diagram printable worksheets include a friction-based subset where total mechanical energy at the endpoint is measurably less than at the start. Students calculate the energy difference and identify it as thermal energy transferred to the surroundings. On these worksheets the total energy line slopes downward rather than staying flat, which forces students to confront the boundary between ideal and real systems. Teachers can assign these after students are solid on frictionless cases, or use them selectively for students who move through the standard problems early.
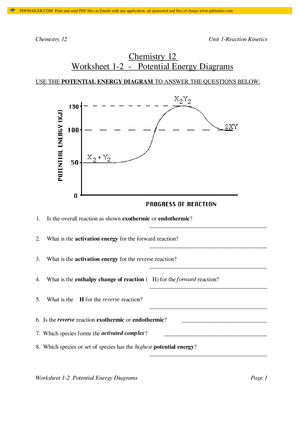
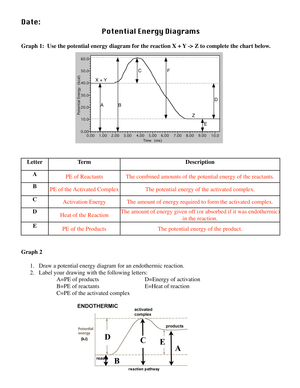
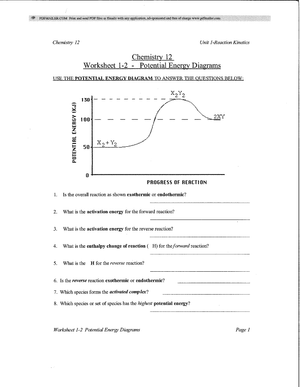
How is a mechanical PE diagram different from a chemistry reaction coordinate diagram?
Tenth graders enrolled simultaneously in chemistry and physics encounter both diagrams within months of each other, and the visual similarity causes real confusion. A mechanical PE diagram tracks the macroscopic stored energy of an object based on its physical position — height in a gravitational field or compression in a spring. A reaction coordinate diagram tracks microscopic potential energy as chemical bonds break and form during a reaction. The x-axis is not position in space; it is the progress of the reaction. The peak represents activation energy, not maximum height. The two graphs look alike but answer entirely different questions, and making that distinction early prevents students from carrying physics vocabulary — "the object at the bottom has only kinetic energy" — into chemistry problems about enthalpy and bond energy.