These heating curve printable worksheets for 10th grade cover the full thermal sequence from sub-zero solid through superheated gas, with tasks that range from labeling the five standard curve segments to computing multi-step energy totals across phase boundaries. Each worksheet addresses a distinct slice of the topic — some focus on the conceptual picture of kinetic and potential energy, others go straight to calculation — so teachers can mix and match based on where students are in the unit. Problems draw on real thermal properties for water, ethanol, and iron rather than invented values, which keeps the numbers grounded and makes unit-conversion errors easier to diagnose.
The Specific Skills Targeted
The heating curve printable worksheets for 10th grade build five competencies in sequence, moving from conceptual identification to multi-step quantitative analysis.
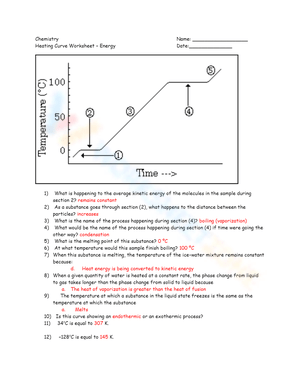
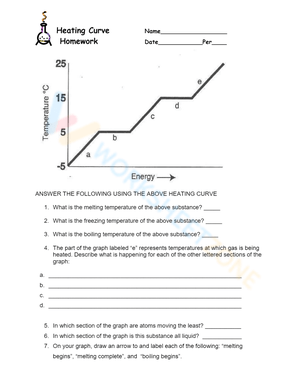
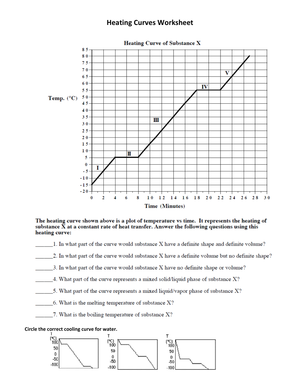
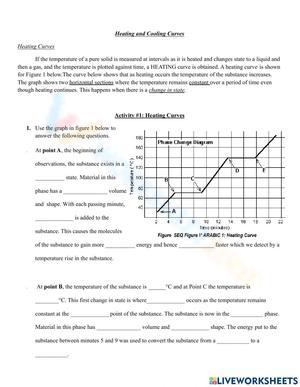
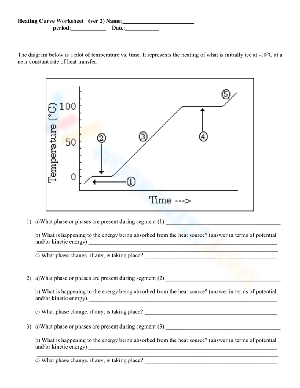
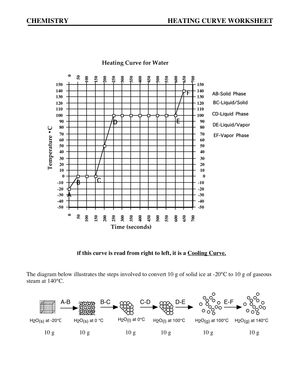
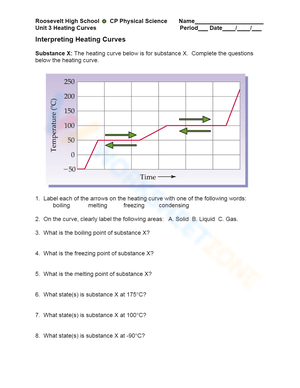
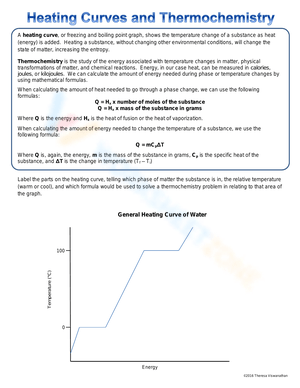
- Labeling the five curve segments — solid slope, melting plateau, liquid slope, vaporization plateau, and gas slope — and identifying the phase or phase-pair present in each
- Distinguishing segments where kinetic energy is changing (temperature rising, single phase present) from plateaus where potential energy is changing (temperature flat, two phases coexisting in equilibrium)
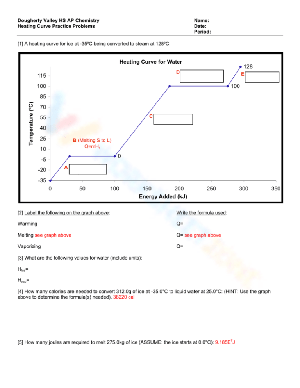
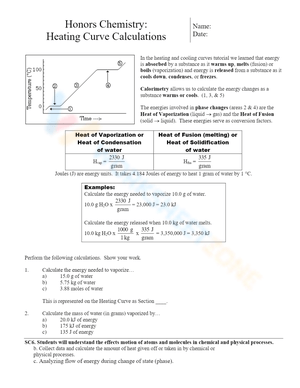
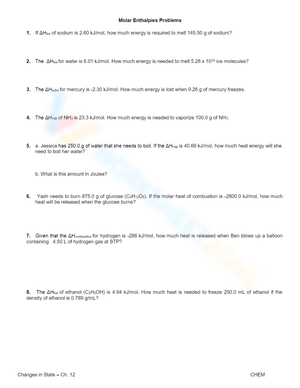
- Applying q = mcΔT to temperature-changing segments with the correct specific heat value for the active phase
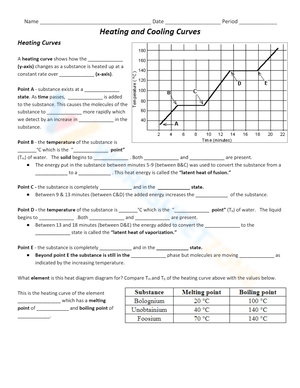
- Applying q = mΔH to phase-transition plateaus using published heats of fusion and vaporization
- Summing all sub-calculations to find the total energy required for a substance to move from one defined temperature to another across one or more phase boundaries
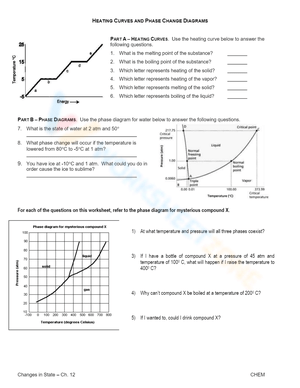
Several worksheets extend this work to comparative graphs showing two or more substances on the same set of axes. In those problems, students read relative intermolecular force strength from plateau lengths and phase-change temperatures rather than retrieving the information from a reference table — a different cognitive task that pushes toward interpretation rather than execution.
Student Errors Worth Anticipating Before You Hand These Out
The most disruptive error is using the wrong specific heat capacity. Water has three distinct c values depending on phase — approximately 2.09 J/(g·°C) for ice, 4.18 J/(g·°C) for liquid water, and 2.01 J/(g·°C) for steam — and students who correctly recognize that a sloped segment calls for q = mcΔT will still default to 4.18 regardless of which slope they are on. A student calculating heat for warming ice from -20°C to 0°C using 4.18 instead of 2.09 doubles the answer. The arithmetic runs cleanly, the result looks plausible, and the error goes undetected unless you check the setup rather than the final number.
Unit collision is the second consistent problem. Heats of fusion and vaporization appear in kJ/g in most reference tables, while students enter mass in grams and expect a final answer in joules. The calculation proceeds without complaint, and the result lands off by a factor of one thousand. Requiring explicit unit cancellation — written out, not implied — catches this at the setup stage rather than after the test is scored.
A third error is conceptual rather than numerical: students label the plateau as a transition but describe it as one phase turning into another rather than two phases coexisting at equilibrium. That distinction matters when the course reaches phase diagrams and vapor pressure, so it is worth correcting on the worksheet rather than deferring it.
Getting the Most From These Worksheets in Your Unit Plan
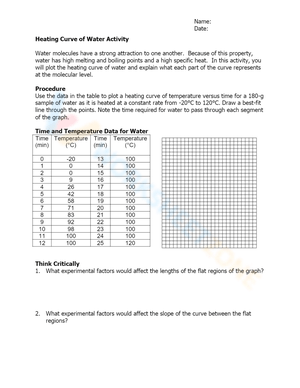
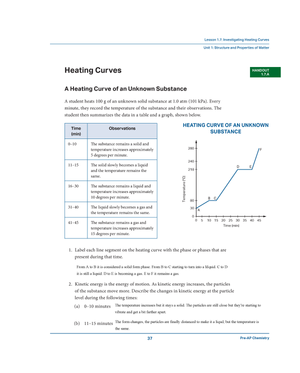
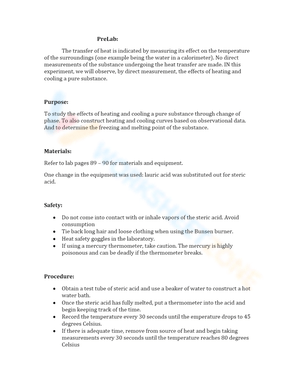
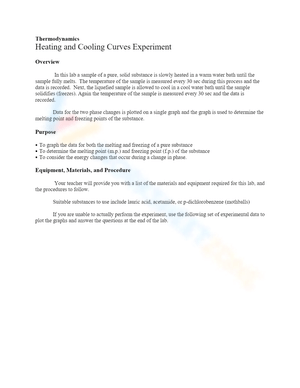
The sequence that works most reliably is lab before worksheet. Students heat ice water, record temperature every thirty seconds, and hand-plot the resulting curve on graph paper before they see a printed version. That twenty-minute exercise gives students a curve they built from their own data. The heating curve printable worksheets for 10th grade then enter as the formal practice layer — students move from their slightly irregular lab data to a clean idealized curve, and the transition makes the printed conventions feel explanatory rather than imposed.
For the calculation worksheets specifically, timing matters. Assigning them as homework a week after the formula introduction leads to formula confusion that classroom reteaching cannot easily untangle. An in-class work period within a day or two of instruction — twenty minutes with the teacher circulating to catch setup errors before they become habits — is worth the class time.
One technique worth trying before any calculating begins: ask students to shade the curve with two colors, one for segments where kinetic energy is changing and another for plateaus where potential energy is changing. Students who are unclear on formula selection are usually also unclear about what the energy is doing at each stage. The shading step forces a physical explanation before a calculation begins, and it surfaces the gap early enough to address it in the same class period.
Standard Alignment
NGSS performance expectation HS-PS3-1 asks students to create computational models that account for energy changes between system components. The multi-step heating curve calculation — where each slope and each plateau contributes a separate sub-result that must be summed correctly — addresses this standard at the algebra level expected in 10th grade. The structured multi-step format also gives teachers a clear view of exactly where students break down: formula selection, value substitution, or unit handling. Phase changes typically fall in 10th grade because students have the prior knowledge of kinetic molecular theory from middle school and the algebra fluency needed for multi-formula problems, while college-level thermodynamic notation and entropy calculations remain ahead.
HS-PS3-2 addresses the relationship between macroscopic energy and particle-level behavior — specifically, the distinction between energy associated with particle motion and energy associated with particle position. The slope-versus-plateau structure of a heating curve maps directly onto that distinction, and the labeling and written-explanation tasks in these worksheets make that mapping explicit rather than leaving it implicit in the graph shape.
Adjusting the Set for a Range of Learners
For students who need more support at the conceptual level, the most effective adjustment is to remove the calculation requirements from the first worksheet entirely and replace them with written descriptions. Ask students to write two sentences per segment: what phase or phases are present and what is happening to the energy at the particle level. That writing task reveals whether students have a working physical model or are pattern-matching labels without understanding — and that distinction changes how you structure the following day.
For students who are ready to push further, heating curve printable worksheets for 10th grade that display two or more substances on the same axes offer the most productive extension. Students compare plateau lengths and phase-change temperatures for water, ethanol, and iron, then construct an argument about relative intermolecular force strength using the quantitative data as evidence. That moves the task from retrieval to genuine scientific reasoning, which is the appropriate ceiling for advanced 10th-grade work on this topic.
A practical adjustment that works in mixed-ability rooms: print two versions of each calculation worksheet, one with a formula reference box and one without. Students who have internalized both formulas and the unit conversions work from the reference-free version; students who still need the lookup focus their attention on problem setup rather than recall. Both versions can run simultaneously without making ability grouping visible.
Frequently Asked Questions
Why does temperature stay flat on the plateau even though heat is still being added?
The added energy is going toward breaking intermolecular attractions rather than increasing particle speed. Temperature is a measure of average kinetic energy, and as long as the energy is being used to overcome forces between molecules — pulling water molecules away from the hydrogen-bonded structure of ice, for example — the average kinetic energy does not rise. The temperature line resumes its upward slope only after the phase change is complete and particles are free to accelerate again.
How should students structure a multi-step total heat calculation?
Students should treat each curve segment as a separate calculation. For each slope, identify the phase, select the specific heat capacity for that phase, and calculate q = mcΔT. For each plateau, use the appropriate latent heat value and calculate q = mΔH. Sum all sub-results. The most common source of an incorrect total is missing a segment — students sometimes skip one of the slopes or forget that a substance moving from well below its melting point to well above its boiling point passes through five distinct segments, not three.
Is there a recommended order for the worksheets within a unit?
Labeling and identification worksheets belong before formula instruction. Students who can describe the physical meaning of each segment make fewer errors when they begin calculating because they are choosing a formula based on understanding rather than guessing from context. Calculation worksheets work best within a day or two of the formula introduction. Comparative-substance worksheets, which ask students to reason across curves rather than execute a single set of calculations, fit best near the end of the unit when the full conceptual picture is in place.
Do any worksheets in the set address cooling curves?
Several worksheets include cooling-curve problems, and some ask students to sketch the cooling version of a curve they have already analyzed as a heating problem. Condensation and freezing are exothermic — the curve slopes downward and levels off at the same temperatures where the heating version leveled off — but the physical reasoning mirrors the heating case exactly. Students who have worked through the heating problems consistently find the cooling problems more approachable because the underlying logic is already familiar.