


0
Views
0
Downloads
0.0
0
Save
0 Likes
Understanding Heating Curves Graph
0 Views
0 Downloads
Paste this activity's link or code into your existing LMS (Google Classroom, Canvas, Teams, Schoology, Moodle, etc.).
Students can open and work on the activity right away, with no student login required.
You'll still be able to track student progress and results from your teacher account.
Information
Description
What It Is:
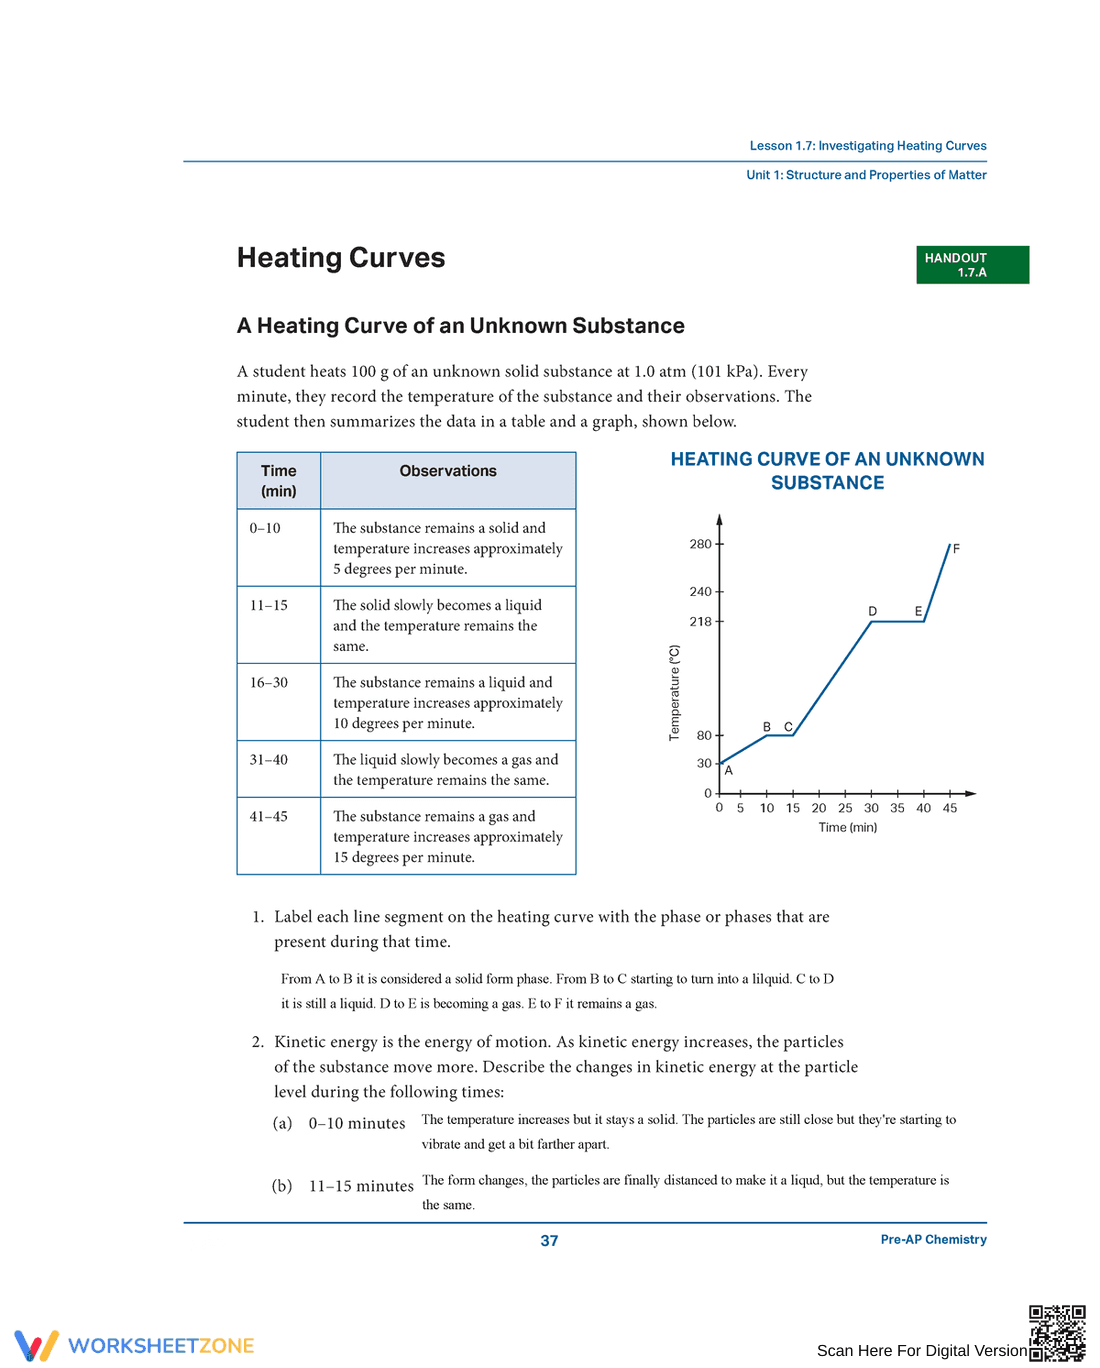
The worksheet presents a lesson on heating curves. It includes a scenario where a student heats 100g of an unknown solid substance and records temperature changes over time. A table shows time intervals (0-10 minutes, 11-15 minutes, 16-30 minutes, 31-40 minutes, 41-45 minutes) and corresponding observations about the substance's state (solid, liquid, gas) and temperature changes. A graph depicts the heating curve of the unknown substance, with temperature (C) on the y-axis and time (minutes) on the x-axis, showing distinct phases labeled A, B, C, D, and E. There are questions asking students to label each line segment with the corresponding phase and to describe the changes in kinetic energy during specific time intervals (0-10 minutes and 11-15 minutes).
Grade Level Suitability:
This worksheet is suitable for high school students, specifically grades 9-12, studying chemistry or physical science. The concepts of phase changes, heating curves, and kinetic energy are typically introduced at this level. The complexity of the graph interpretation and the analysis of particle behavior during phase transitions align with high school science curricula.
Why Use It:
This worksheet helps students understand the relationship between heat, temperature, and phase changes of matter. It reinforces the concepts of solid, liquid, and gas states, as well as the energy involved in transitions between these states. Students will develop skills in interpreting graphical data, analyzing experimental observations, and applying scientific concepts to real-world scenarios. It also helps them connect macroscopic observations with microscopic particle behavior.
How to Use It:
Students should first read the introductory scenario and examine the provided data table. Then, they should analyze the heating curve graph, identifying the different phases present during each segment. They should label each segment (A-E) with the corresponding phase. Finally, they should answer the questions, describing the phase transitions and explaining how kinetic energy changes during specific time intervals, using the data and graph as evidence.
Target Users:
The target users are high school students in chemistry or physical science courses. It is also suitable for teachers looking for supplemental materials to reinforce the concepts of heating curves, phase changes, and kinetic energy. Homeschooling parents teaching science concepts would also find this worksheet useful.