


1 / 2
0
Views
0
Downloads
0.0
0
Save
0 Likes
Practice Heating and Cooling Curves
0 Views
0 Downloads
Paste this activity's link or code into your existing LMS (Google Classroom, Canvas, Teams, Schoology, Moodle, etc.).
Students can open and work on the activity right away, with no student login required.
You'll still be able to track student progress and results from your teacher account.
Information
Description
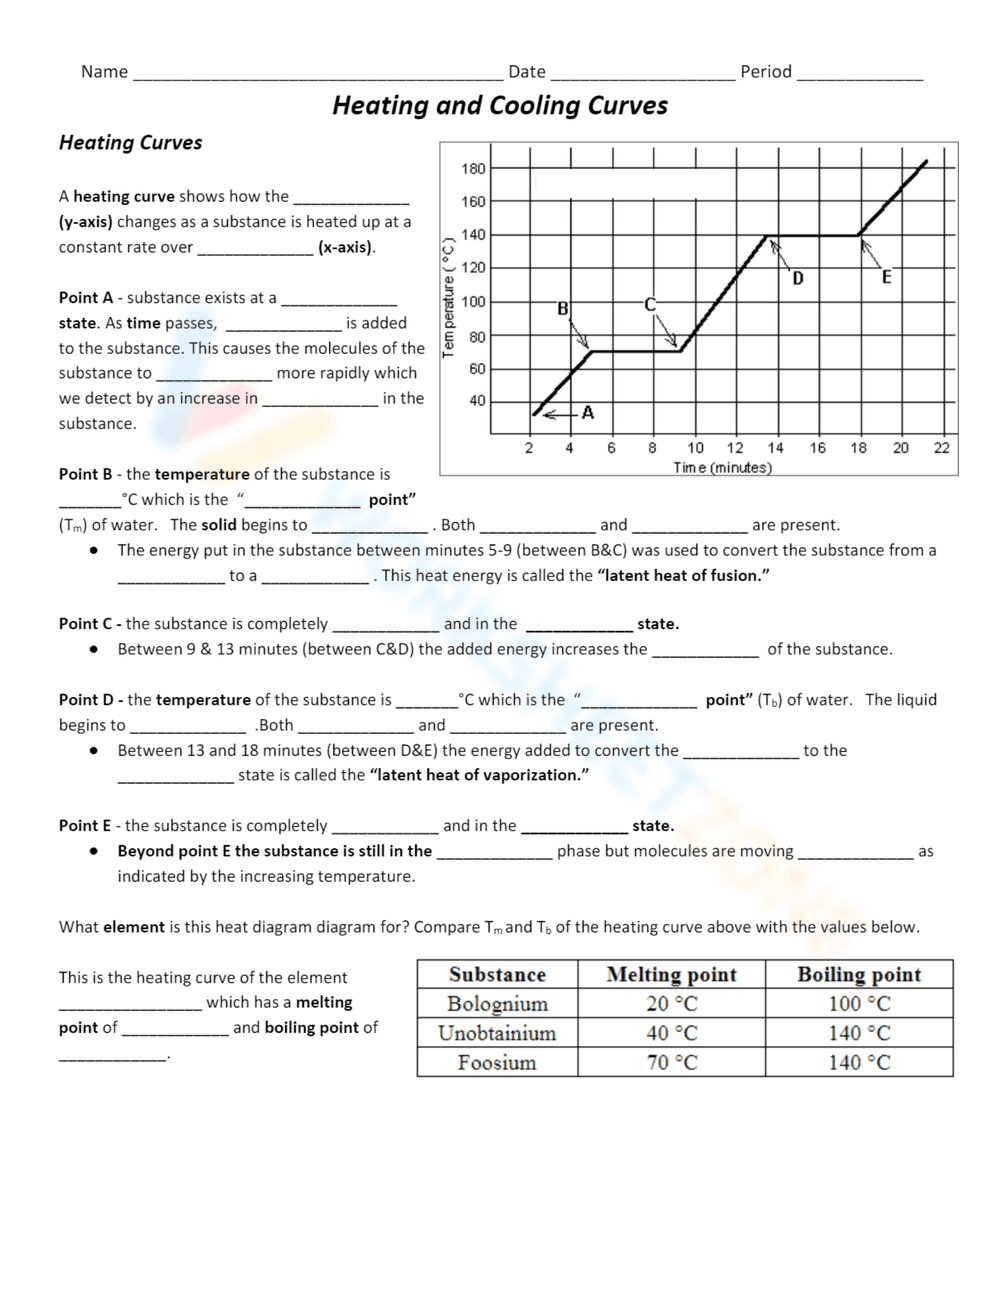
What It Is:
This is an educational worksheet about heating and cooling curves. It features a graph showing temperature changes over time as a substance is heated. The worksheet includes fill-in-the-blank questions about different points on the curve (A, B, C, D, E), asking about the state of the substance (solid, liquid, gas), temperature, latent heat of fusion, and latent heat of vaporization. It also presents a table with melting and boiling points for different substances (Bolognium, Unobtainium, Foosium) and asks students to compare these values to the graph.
Grade Level Suitability:
This worksheet is suitable for high school students, specifically grades 9-12, studying chemistry or physics. It requires an understanding of phase changes, heat transfer, and interpreting graphs, which are typically covered in these grades.
Why Use It:
This worksheet helps students understand the relationship between temperature and phase changes during heating and cooling. It reinforces concepts like melting point, boiling point, latent heat, and the different states of matter. It also promotes graph reading and analytical skills.
How to Use It:
Students should first study the heating curve graph. Then, they should answer the fill-in-the-blank questions by interpreting the graph and recalling their knowledge of phase changes. Finally, they should compare the melting and boiling points provided in the table with the heating curve to identify the element represented in the diagram.
Target Users:
This worksheet is designed for high school students in chemistry or physics classes. It can also be used by teachers as a review activity or assessment tool for the topic of heating and cooling curves and phase changes.