


1 / 6
0
Views
0
Downloads
Save
0 Likes
Heating Curve Worksheet: Understanding Phase Transitions
0 Views
0 Downloads
Paste this activity's link or code into your existing LMS (Google Classroom, Canvas, Teams, Schoology, Moodle, etc.).
Students can open and work on the activity right away, with no student login required.
You'll still be able to track student progress and results from your teacher account.
Information
Description
What It Is:
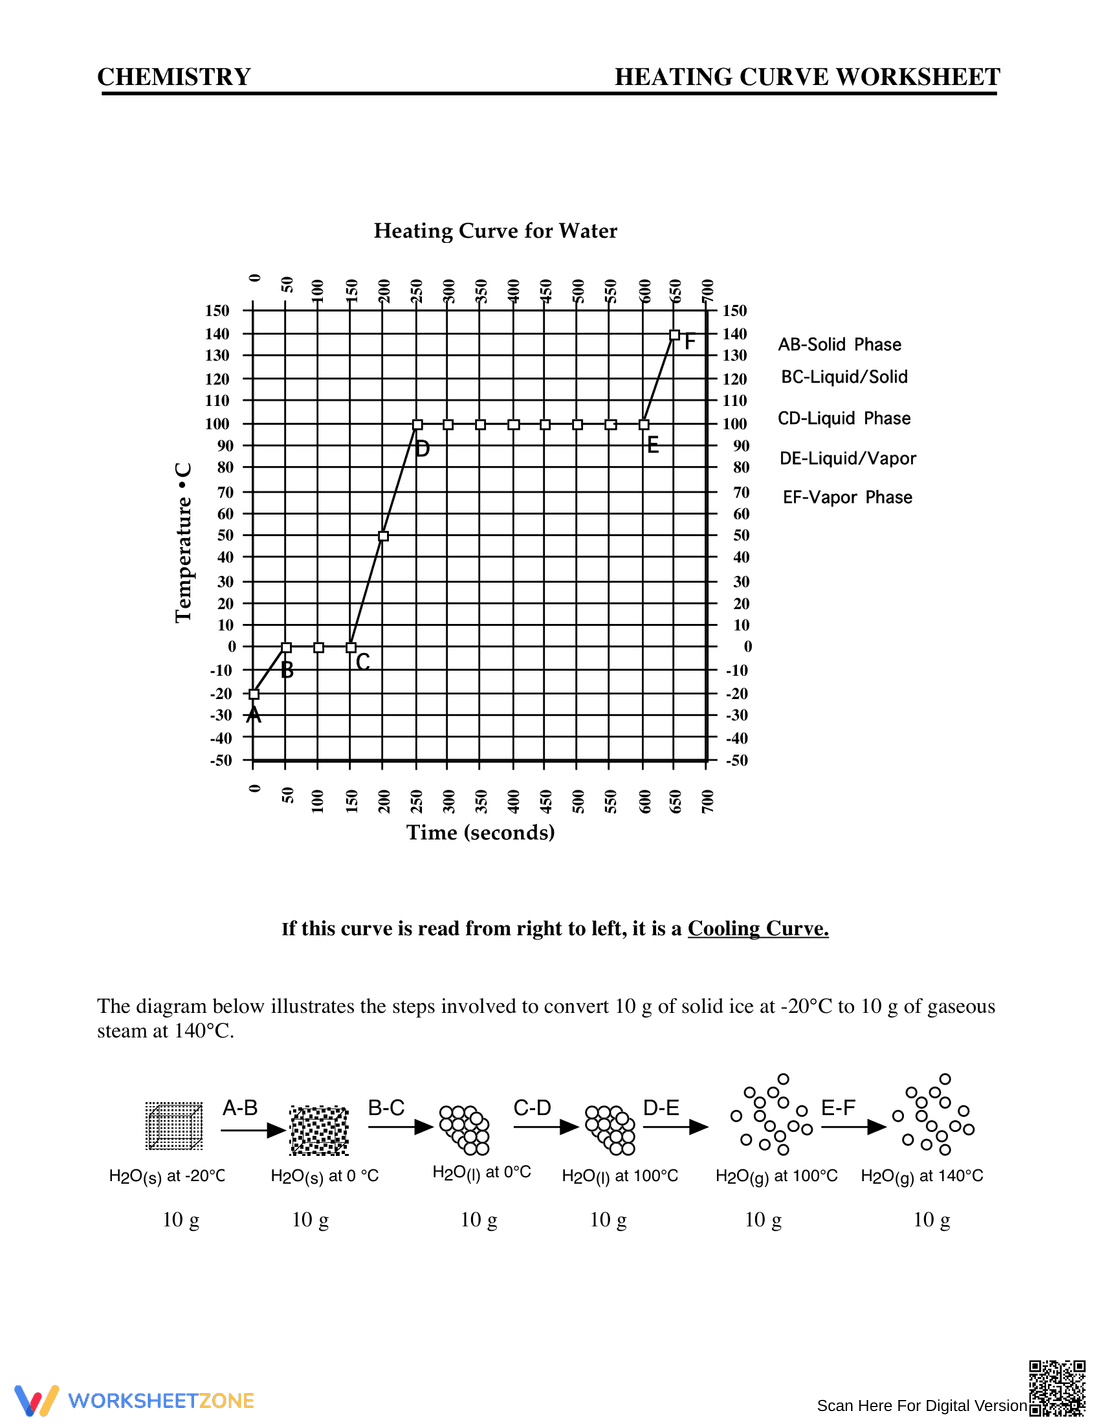
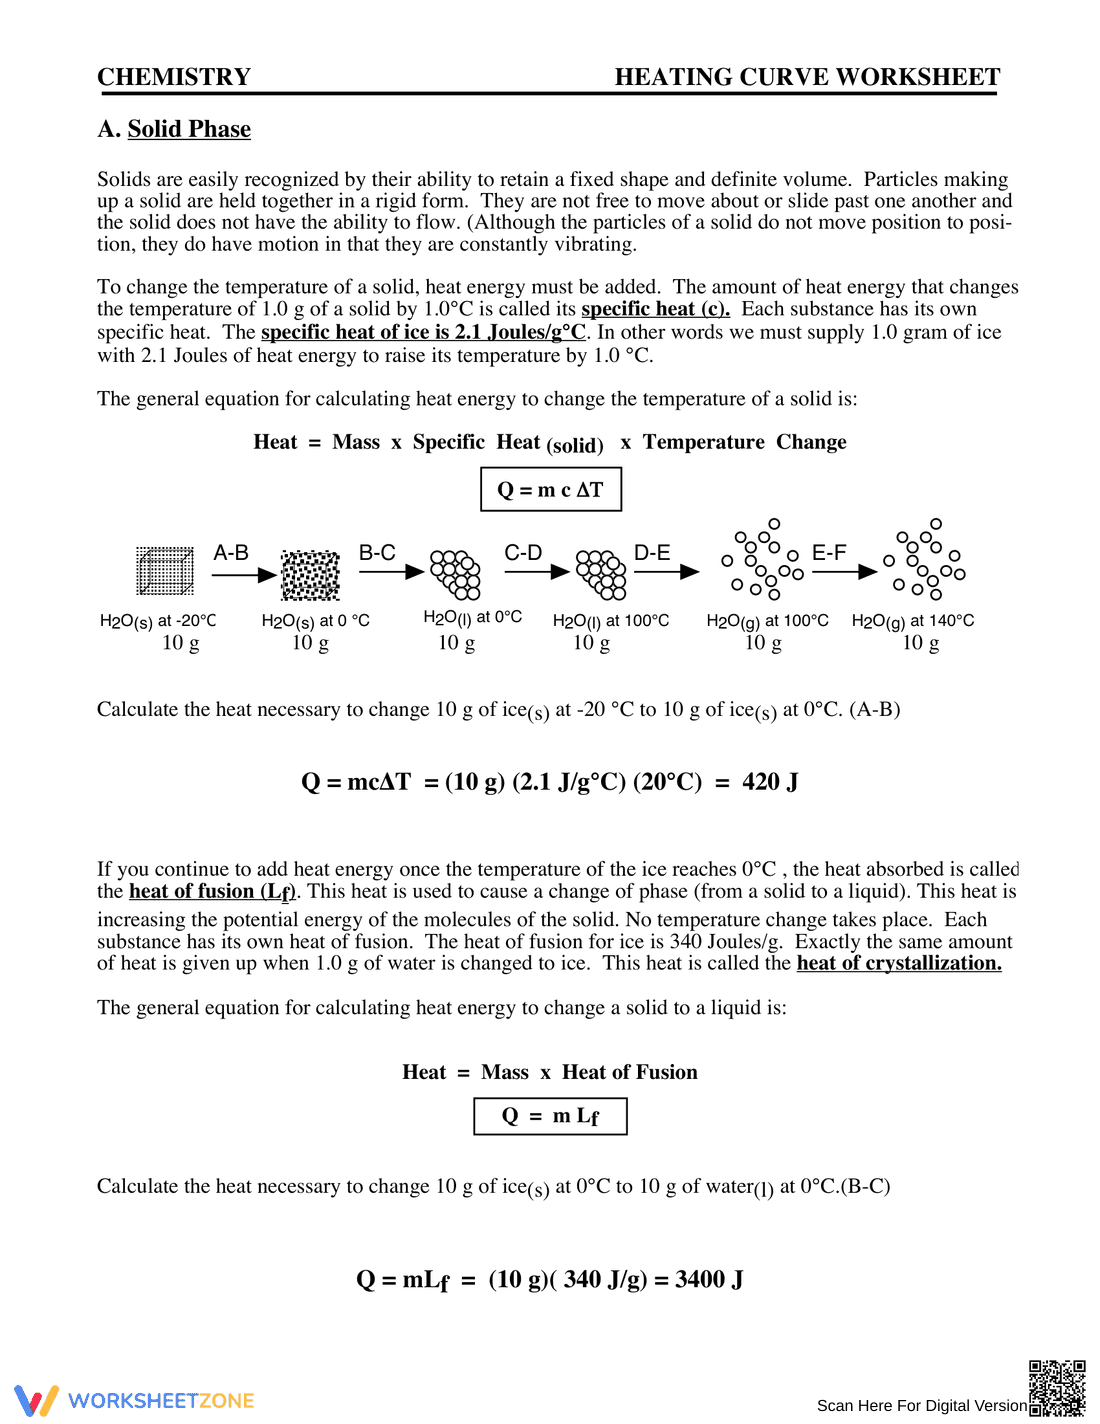
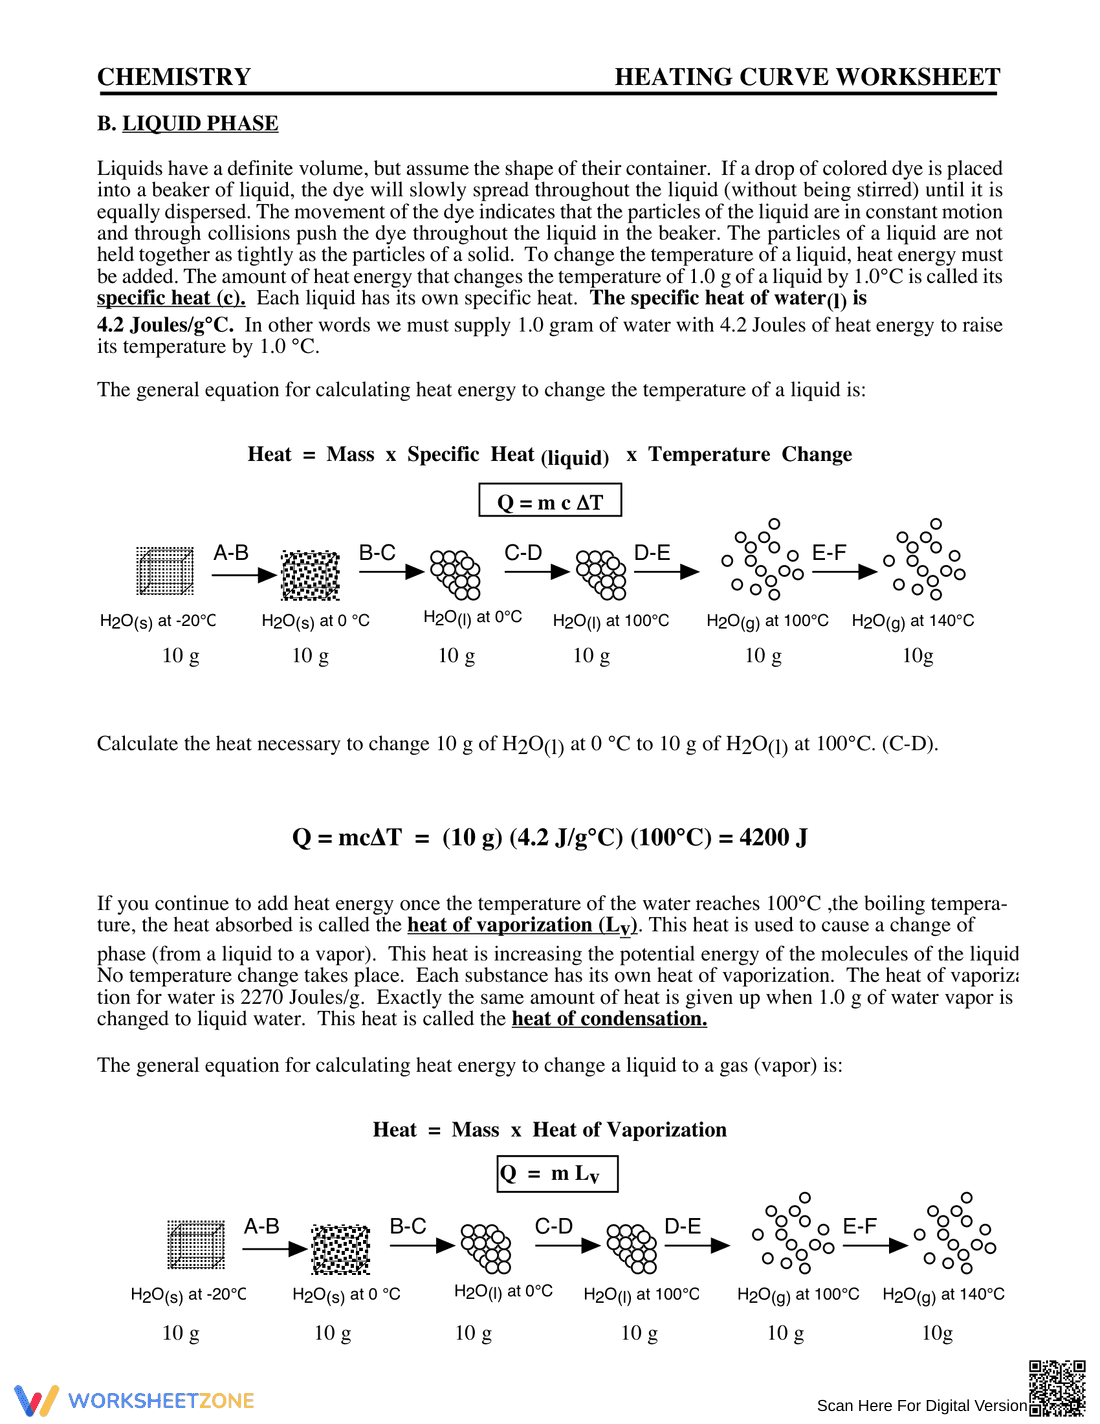
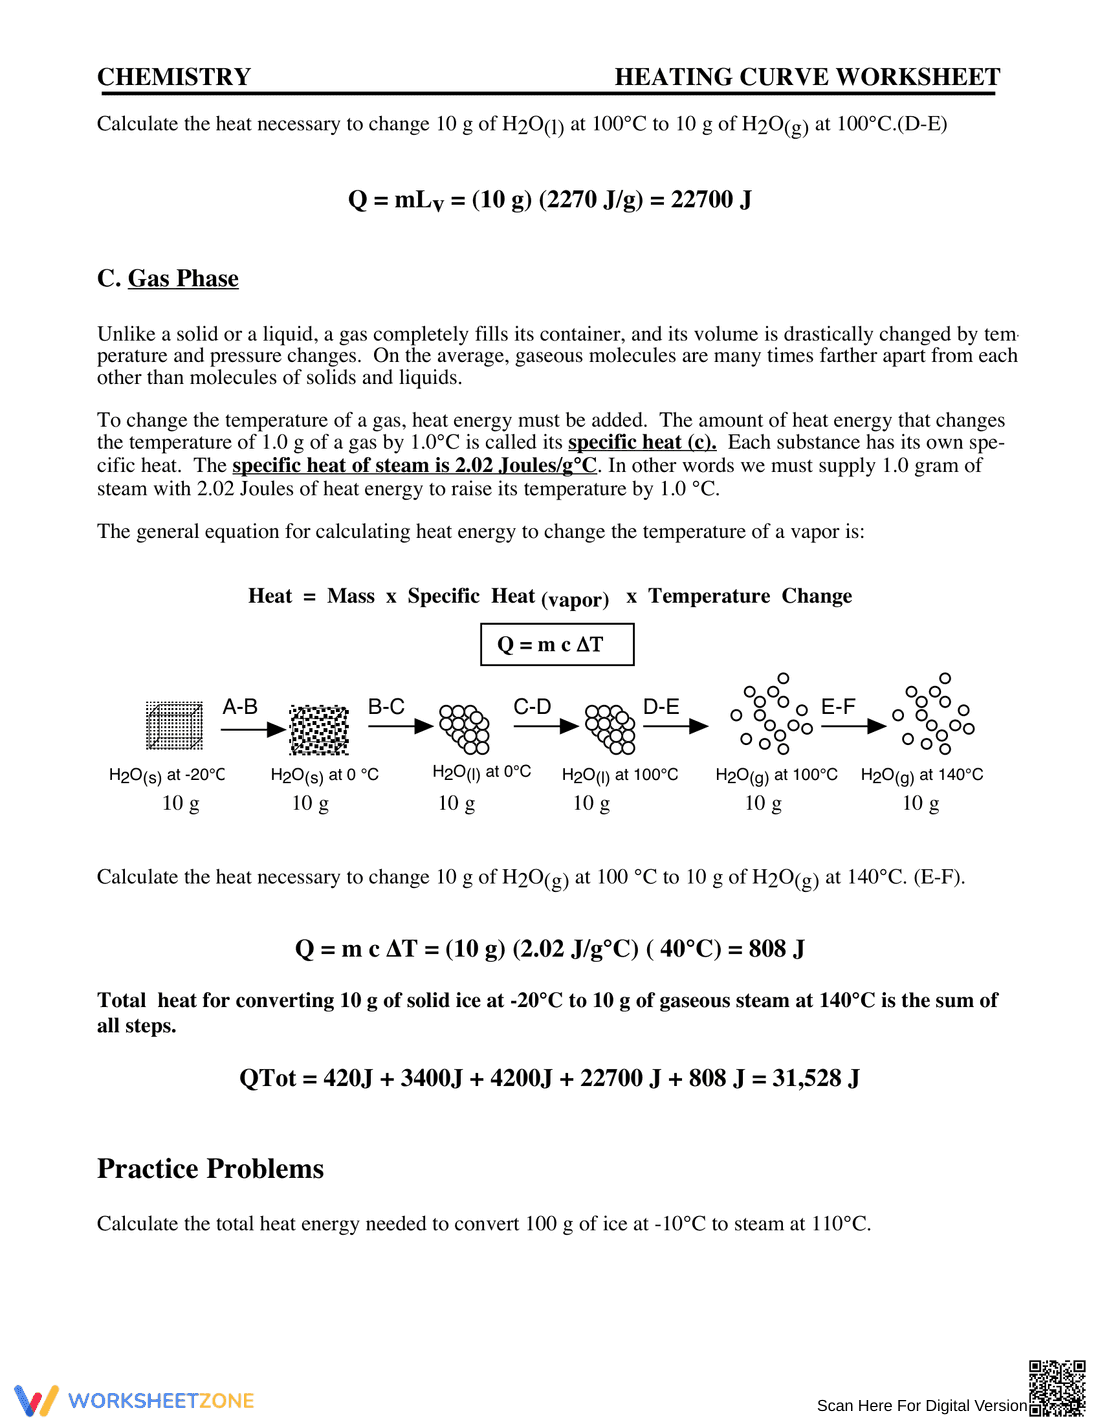
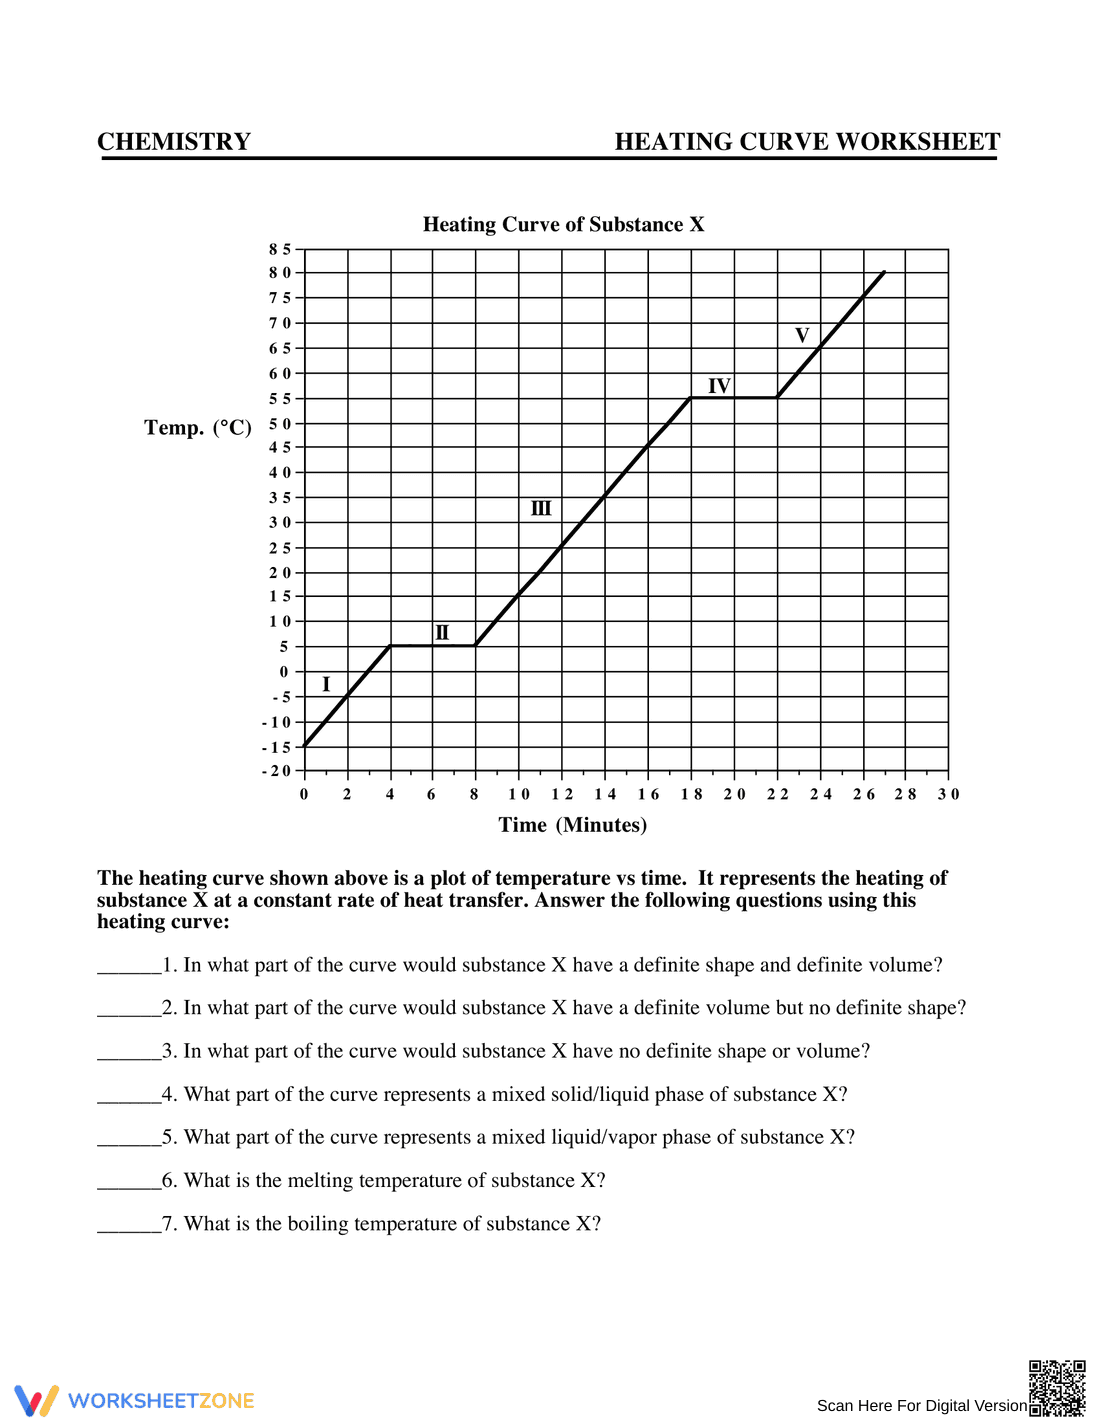
This is a chemistry worksheet focused on heating curves. It includes a graph of a heating curve for water, plotting temperature in Celsius against time in seconds. The graph shows different phases of water (solid, liquid, vapor) as the temperature increases. Below the graph, there is a diagram illustrating the phase changes of H2O, from solid ice at -20°C to gaseous steam at 140°C, with corresponding representations of the molecules in each phase.
Grade Level Suitability:
This worksheet is suitable for high school students, specifically grades 9-12. It involves understanding phase changes, interpreting graphs, and applying knowledge of chemistry concepts, making it appropriate for a high school chemistry curriculum.
Why Use It:
This worksheet helps students visualize and understand the concept of heating curves and phase changes. It allows them to connect the graph to the physical changes occurring in the substance as heat is added. It reinforces understanding of the relationship between temperature, time, and the different phases of matter.
How to Use It:
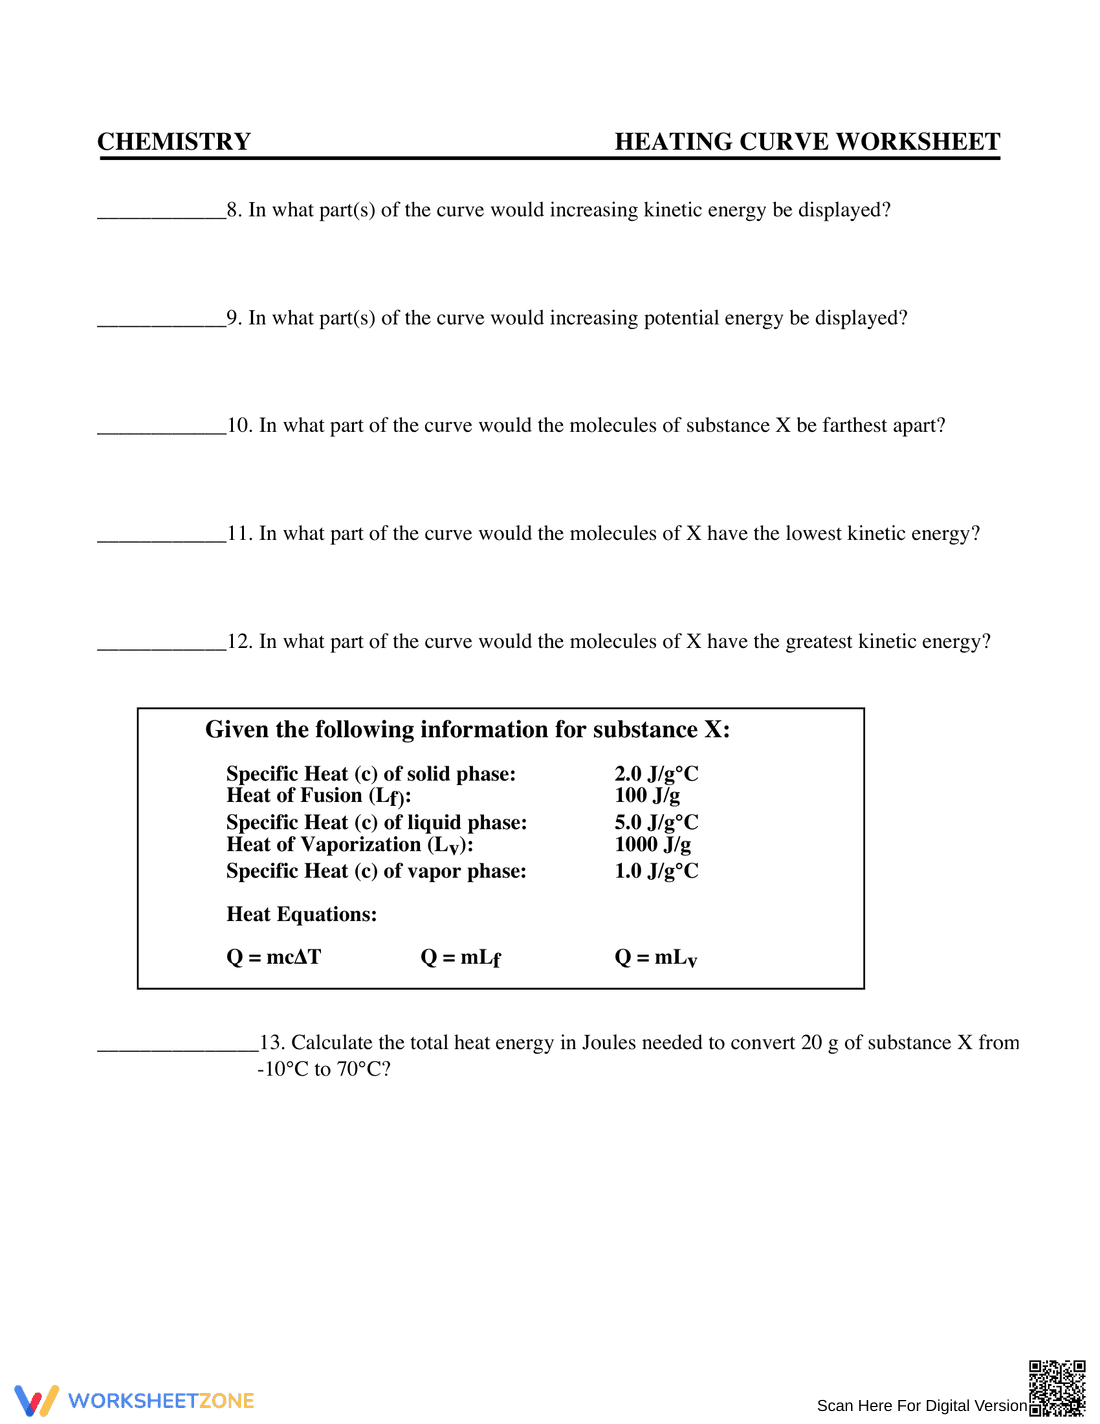
Students can use the worksheet to analyze the provided heating curve graph, identifying the different phases and the temperatures at which phase changes occur. They can also use the diagram to understand the molecular changes occurring during each phase transition. It could be used as an in-class activity, homework assignment, or review material.
Target Users:
The target users are high school chemistry students learning about phase changes, heating curves, and the properties of water. It is also suitable for teachers looking for visual aids and activities to teach these concepts.
This is a chemistry worksheet focused on heating curves. It includes a graph of a heating curve for water, plotting temperature in Celsius against time in seconds. The graph shows different phases of water (solid, liquid, vapor) as the temperature increases. Below the graph, there is a diagram illustrating the phase changes of H2O, from solid ice at -20°C to gaseous steam at 140°C, with corresponding representations of the molecules in each phase.
Grade Level Suitability:
This worksheet is suitable for high school students, specifically grades 9-12. It involves understanding phase changes, interpreting graphs, and applying knowledge of chemistry concepts, making it appropriate for a high school chemistry curriculum.
Why Use It:
This worksheet helps students visualize and understand the concept of heating curves and phase changes. It allows them to connect the graph to the physical changes occurring in the substance as heat is added. It reinforces understanding of the relationship between temperature, time, and the different phases of matter.
How to Use It:
Students can use the worksheet to analyze the provided heating curve graph, identifying the different phases and the temperatures at which phase changes occur. They can also use the diagram to understand the molecular changes occurring during each phase transition. It could be used as an in-class activity, homework assignment, or review material.
Target Users:
The target users are high school chemistry students learning about phase changes, heating curves, and the properties of water. It is also suitable for teachers looking for visual aids and activities to teach these concepts.