























Ready Proportional Representations Worksheet | Grade 7 Math
Paste this activity's link or code into your existing LMS (Google Classroom, Canvas, Teams, Schoology, Moodle, etc.).
Students can open and work on the activity right away, with no student login required.
You'll still be able to track student progress and results from your teacher account.
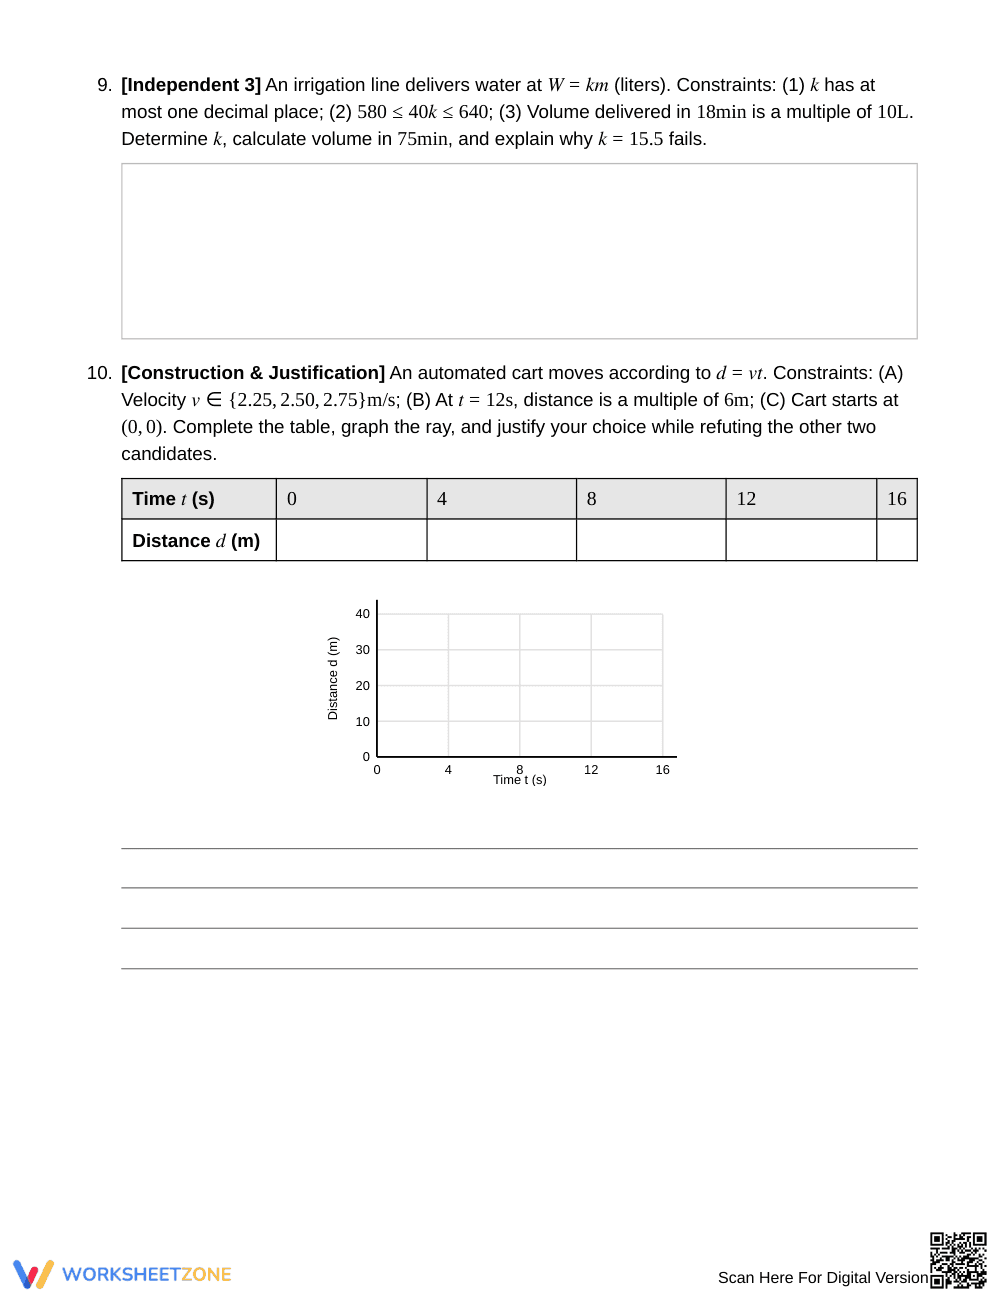
This Grade 7 math worksheet develops students' ability to represent proportional relationships across tables, equations, and graphs under constraints. Learners analyze given rates, test constant quotients, and synthesize mathematical models satisfying simultaneous inequality and divisibility criteria to achieve proportional mastery.
At a Glance
- Grade: 7 · Subject: Math
- Standard:
7.RP.A.2— Recognize and represent proportional relationships between quantities across tables, graphs, equations, and verbal descriptions- Skill Focus: Design Consistent Representations Under a Constraint
- Format: 5 pages · 10 structured problems · Full answer key included · PDF
- Best For: Proportional relationship mastery, guided practice, and review
- Time: 45–60 minutes
What's Inside
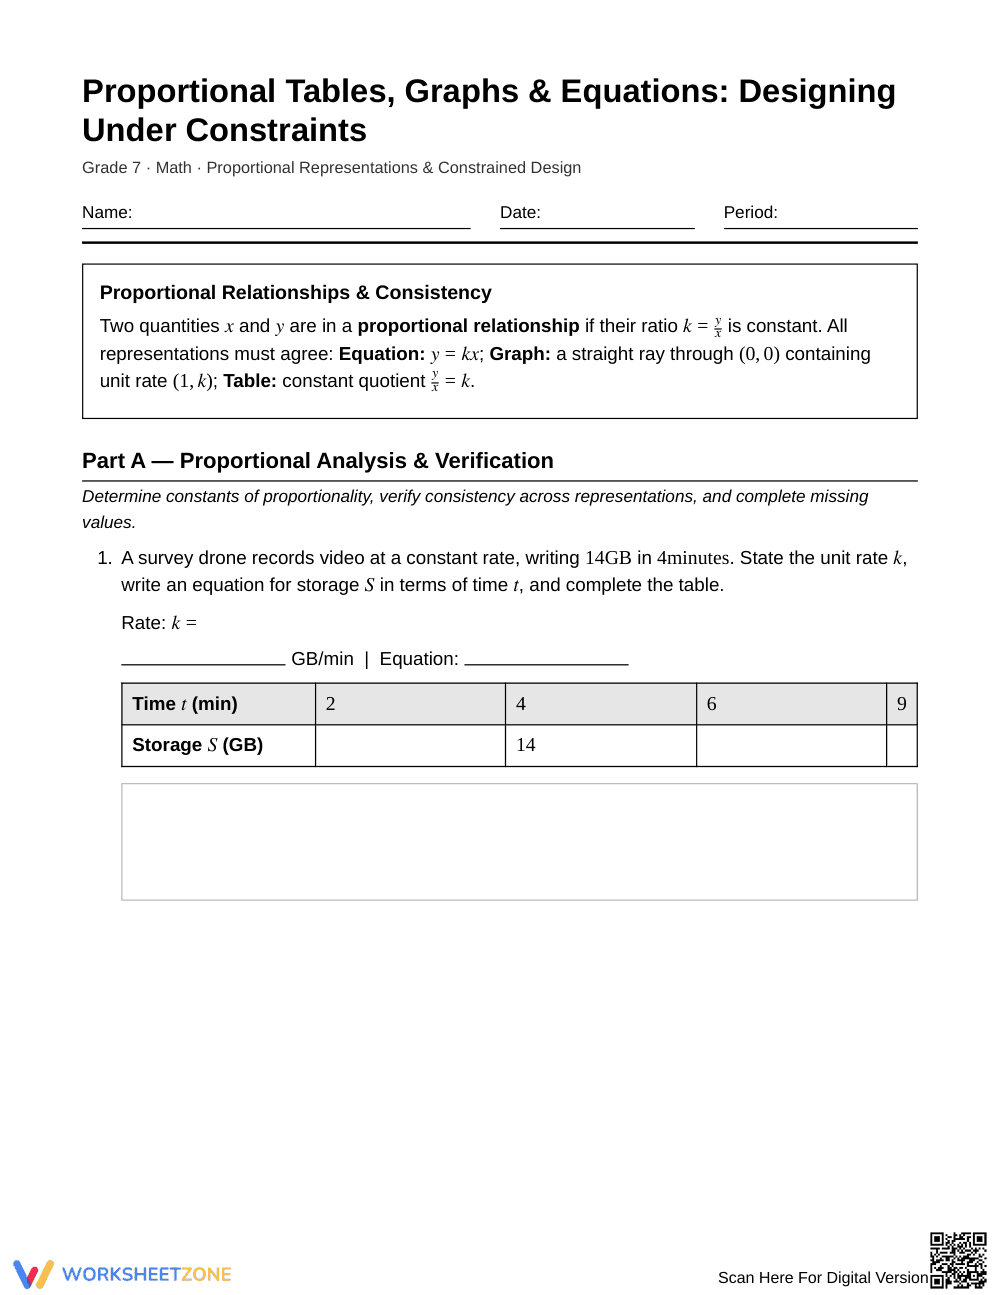
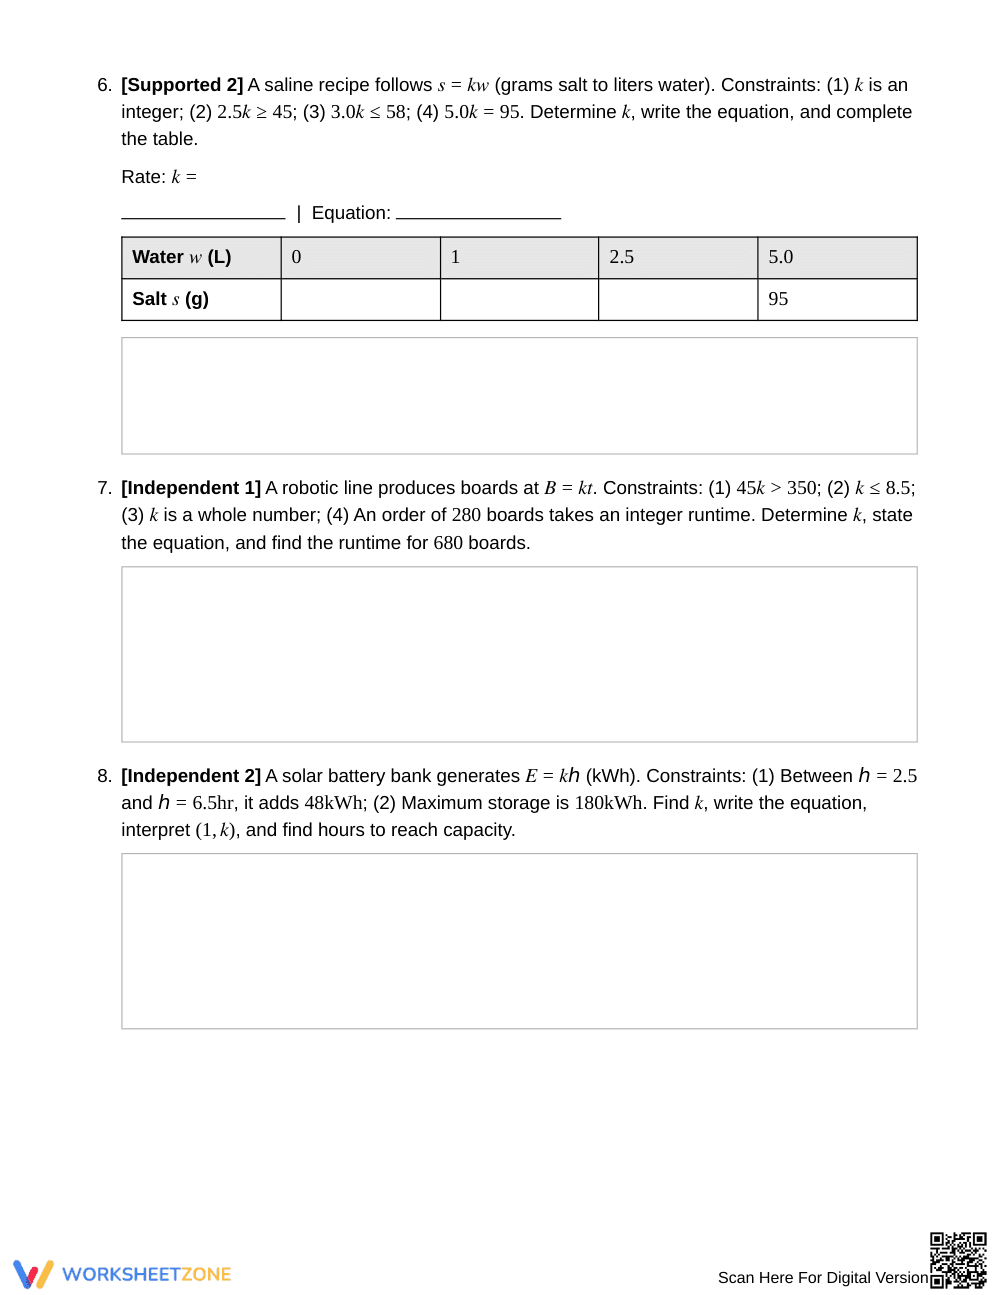
This 5-page packet features 10 tasks organized into two sections. Part A emphasizes verification, providing data tables, graphs, and rate scenarios to evaluate unit rates and identify key coordinates. Part B guides students through constrained modeling using inequalities, integer conditions, and graph construction. A 2-page answer key provides complete solutions and visual models.
Skill Progression
- Guided practice (Problems 1–4): Students analyze tables, linear graphs, and formulas, verifying constant rates and calculating missing values with structural prompts.
- Supported practice (Problems 5–6): Scenarios introduce boundary constraints, prompting learners to solve inequalities, identify feasible rates, and complete tables.
- Independent practice (Problems 7–10): Students evaluate multiple simultaneous conditions, eliminate invalid rates, compute runtimes, and construct a justified ray.
This gradual-release sequence moves students systematically from concrete verification to complex constrained synthesis.
Standards Alignment
Primary alignment focuses on 7.RP.A.2: Recognize and represent proportional relationships between quantities using tables, equations, and graphs. Parameter boundaries also support 7.EE.B.4 by applying algebraic inequalities. Both standard codes can be copied directly into lesson plans, IEP goals, or district curriculum mapping tools.
How to Use It
Use this packet following direct instruction on proportional rates to solidify multi-representational fluency. During independent work, monitor whether students verify ratio consistency across all table rows or ensure graphs originate at (0,0). The expected completion time is 45 to 60 minutes.
Who It's For
This worksheet serves Grade 7 students, accelerated Grade 6 classes, or intervention groups targeting linear relationships. Support developing learners with reference charts for unit rate equations, or challenge advanced students to write constraint sets. Pair this resource with direct instruction on graphing proportional relationships from equations.
Grounded in the gradual-release framework established by Fisher & Frey (2014), this instructional resource builds conceptual fluency in standard 7.RP.A.2 by moving learners from structured verification of proportional relationships to independent constrained design. Research shows that integrating multiple mathematical representations—verbal, tabular, graphical, and algebraic—substantially deepens student understanding of constant rates of change. By requiring students to design models under simultaneous boundary conditions rather than merely calculating unit rates, the 10 problems foster strategic problem-solving and rigorous mathematical reasoning. The progression scaffolds student work systematically: learners first analyze established rate tables, progress through supported multi-constraint problems, and finally construct graphs and written justifications independently. This deliberate shift from teacher-facilitated analysis to autonomous synthesis ensures students master the core demands of 7.RP.A.2 while building lasting algebraic reasoning skills that transfer directly to higher-level linear functions and algebraic models.


