































Ready Natural Selection Data Worksheet | Grade 8-12 Science

Paste this activity's link or code into your existing LMS (Google Classroom, Canvas, Teams, Schoology, Moodle, etc.).
Students can open and work on the activity right away, with no student login required.
You'll still be able to track student progress and results from your teacher account.
This natural selection worksheet provides high school and middle school science students with targeted practice interpreting real-world population data. Learners analyze frequency tables and line graphs to distinguish between directional, disruptive, and stabilizing selection while directly evaluating common evolutionary misconceptions through rigorous evidence-based reasoning.
At a Glance
- Grade: Grades 8–12 · Subject: Science
- Standard: Evidence Interpretation — Analyze population data to explain natural selection patterns across successive generations
- Skill Focus: Natural selection data analysis and claim evaluation
- Format: 4 pages · 18 problems · Answer key included · PDF
- Best For: High school biology data interpretation
- Time: 40–50 minutes
What's Inside
The 4-page activity contains 18 carefully structured items centered on three distinct biological scenarios: peppered moth-style industrial melanism in beetles, finch beak variation across three isolated islands, and longitudinal drought data tracking beak depth over eight years. A thorough 4-page answer key provides complete model explanations and numerical justification for every question.
Skill Progression
- Guided practice (Part A, 4 problems): Students examine a simplified beetle population table, calculate percentage shifts across 10 generations, and refute the misconception that individual organisms adapt their traits intentionally during their lifetimes.
- Supported practice (Part B, 6 problems): Learners compare three separate island populations, classifying each environmental outcome into directional, disruptive, or stabilizing selection based on multi-column distribution data.
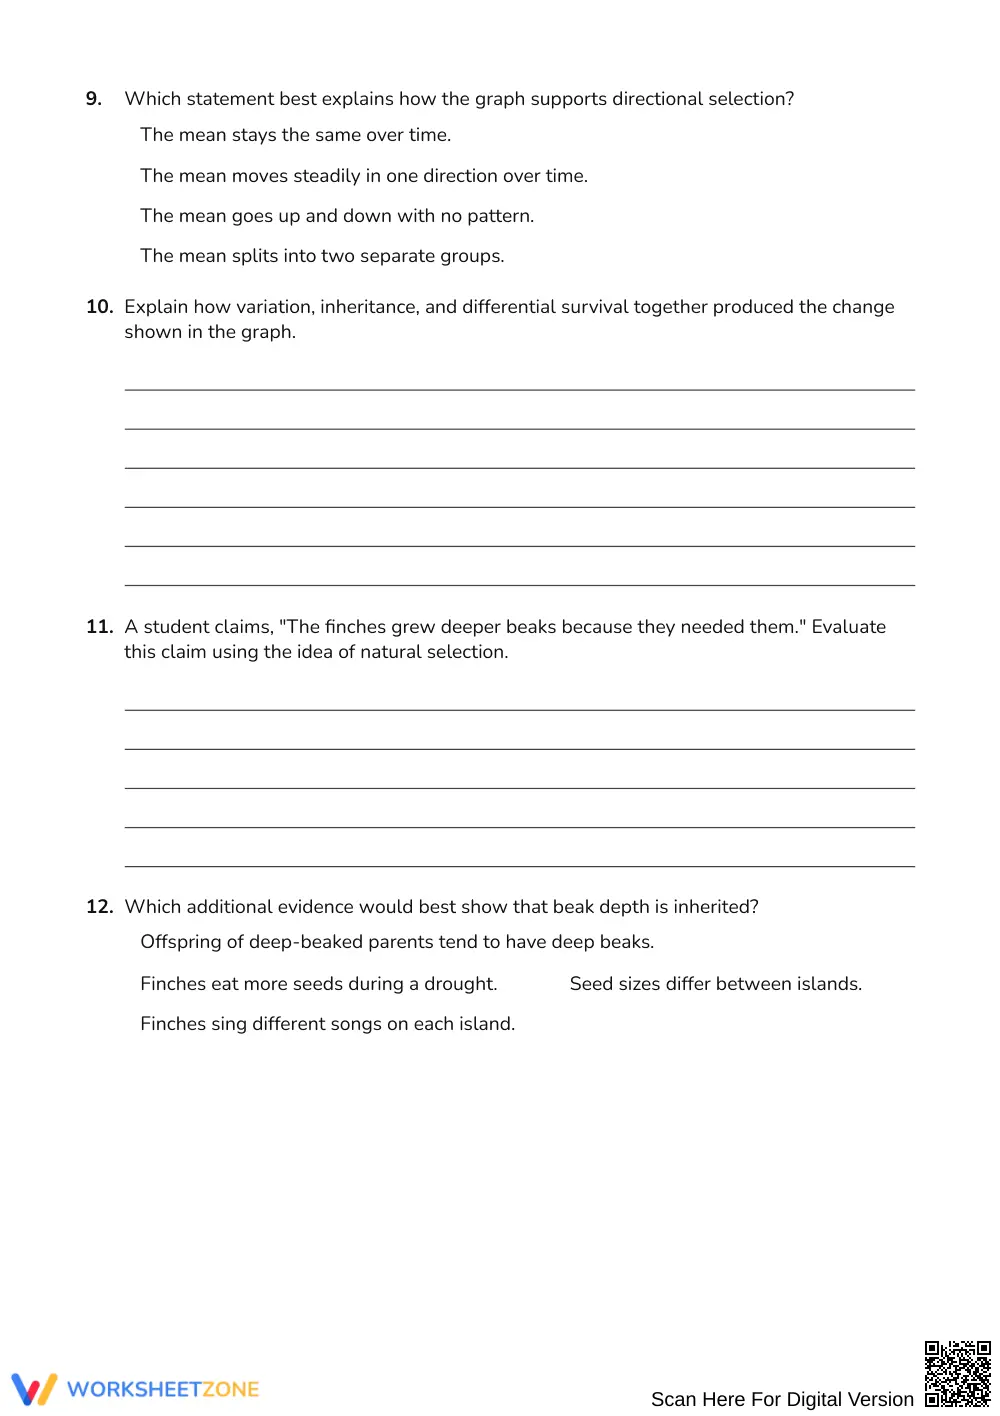
- Independent practice (Part C, 8 problems): Working with a longitudinal line graph, students independently analyze selective pressure from a drought and write evidence-based arguments connecting variation, inheritance, and differential reproductive success.
This structured progression reflects the gradual-release model, transitioning students from teacher-guided table analysis toward independent biological argument evaluation.
Standards Alignment
This activity aligns with secondary life science standards requiring students to construct explanations based on evidence for how natural selection leads to adaptation of populations. Students synthesize quantitative evidence to demonstrate how environmental shifts alter trait frequencies over time. Both standard codes can be copied directly into lesson plans, IEP goals, or district curriculum mapping tools.
How to Use It
Assign this resource immediately after direct instruction on natural selection mechanisms to anchor theoretical definitions in authentic data analysis. During classwork, circulate to check Part A's explanation question; students frequently struggle to articulate that individual organisms cannot alter inherited traits in response to need. Expect completion within 40 to 50 minutes.
Who It's For
This resource serves general biology, AP Biology, and Grade 8 integrated science classes. Built-in numerical tables provide scaffolding for emerging data analysts, while free-response evaluation prompts challenge advanced thinkers. Pair this worksheet directly with a short video case study on the Galápagos finches to reinforce real-world scientific field observation.
Interpreting quantitative evolutionary models is critical for secondary science proficiency. According to EdReports 2024, high-quality science instruction requires regular opportunities for learners to interpret authentic empirical data, evaluate competing claims, and construct written explanations rooted in evidence rather than memorized definitions. This 4-page, 18-task natural selection worksheet operationalizes those exact instructional practices. By examining changing trait frequencies in beetle and finch populations across multiple generations, students investigate how selective pressures drive directional, disruptive, and stabilizing selection. Working through explicit data tables and trend graphs helps students identify and correct persistent evolutionary misconceptions, specifically the belief that individual organisms actively adapt during their lifespan. Grounded in research-backed pedagogical standards, this structured resource equips educators in Grades 8 through 12 to build rigorous scientific literacy, critical graph interpretation skills, and evidence-based argumentation throughout any comprehensive biological evolution unit.


