

























Proven Proportionality Decisions Worksheet | Grade 7 Math
Paste this activity's link or code into your existing LMS (Google Classroom, Canvas, Teams, Schoology, Moodle, etc.).
Students can open and work on the activity right away, with no student login required.
You'll still be able to track student progress and results from your teacher account.
This Grade 7 math worksheet equips students to evaluate, prove, and justify proportionality decisions using unit rates, tables, and algebraic formulas. Through targeted analytical tasks, learners verify whether constant ratios exist across data sets, critique flawed claims, and build mathematical arguments to determine proportional relationships with precision.
At a Glance
- Grade: 7 · Subject: Math
- Standard:
7.RP.A.2— Decide whether two quantities are in a proportional relationship by testing equivalent ratios- Skill Focus: Justify a Proportionality Decision
- Format: 4 pages · 8 problems · Answer key included · PDF
- Best For: Independent practice and analytical reasoning review
- Time: 30–45 minutes
What's Inside
The 4-page resource includes 8 multi-step problems structured across three analytical sections, accompanied by a foundational criteria box and a comprehensive 2-page answer key with worked solutions. Students analyze contextual word problems, construct numerical counterexamples, and justify algebraic methods without reliance on visual guessing.
Skill Progression
- Guided Practice (Part A, 2 tasks): Students evaluate tabular and linear cost scenarios with provided data, computing unit ratios to validate or disprove initial student claims.
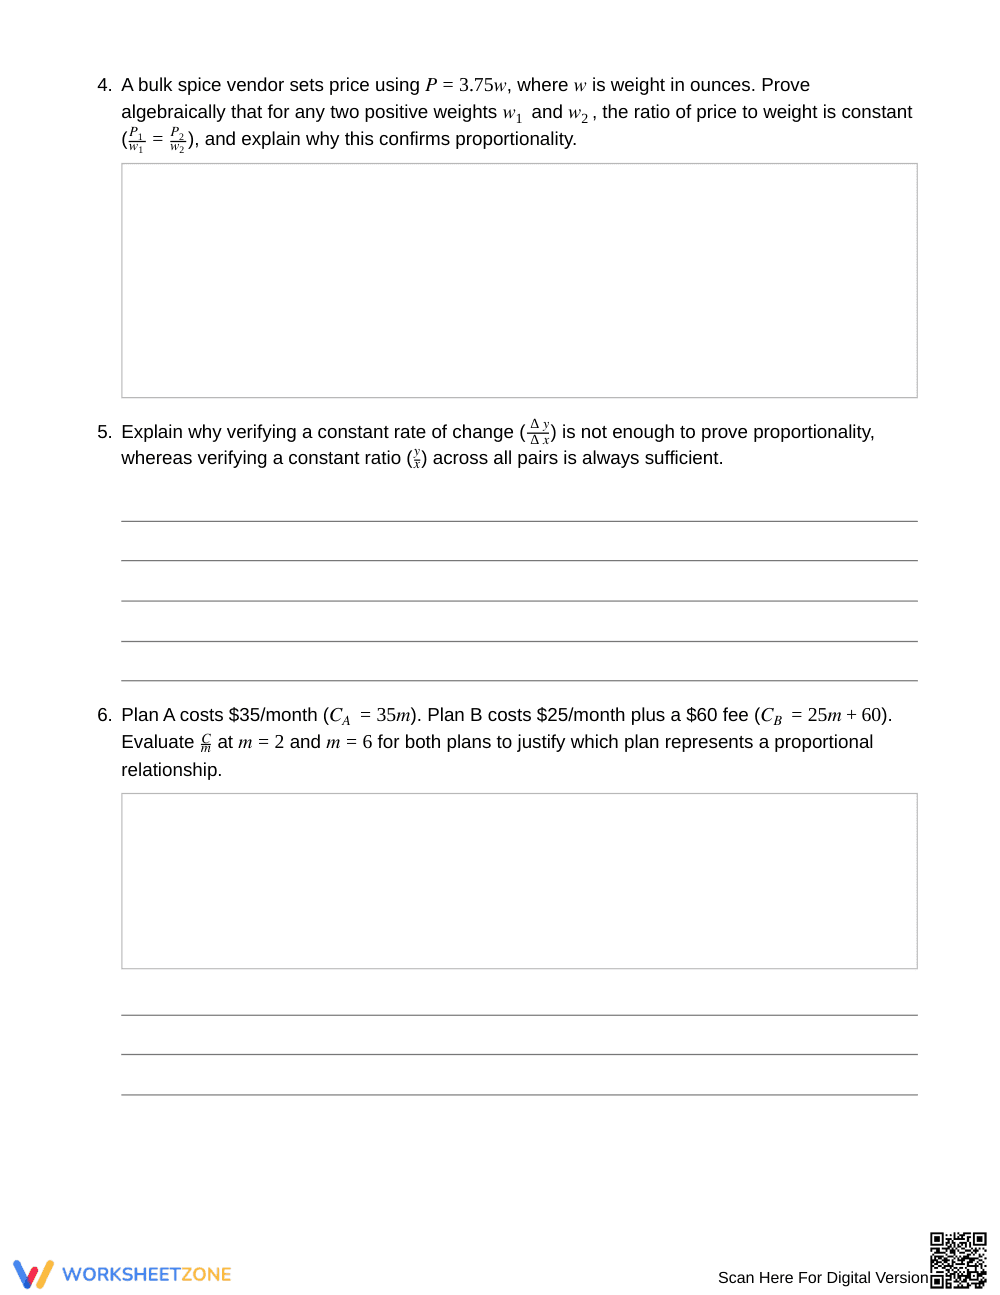
- Supported Practice (Part B, 4 tasks): Learners critique common procedural errors, construct algebraic proofs using variable expressions, and compare fixed-rate versus flat-fee plans.
- Independent Practice (Part C, 2 tasks): Students independently generate custom nonproportional data tables with constant rates of change and analyze geometric formulas using formal validity conditions.
This systematic sequence leverages the gradual release of responsibility framework, transitioning learners from guided verification to independent mathematical justification.
Standards Alignment
This activity aligns directly with 7.RP.A.2, requiring students to decide whether two quantities are in a proportional relationship by testing for equivalent ratios in tables, verbal descriptions, and equations. It also supports 7.RP.A.2.A through testing constant ratios across coordinate values. Both standard codes can be copied directly into lesson plans, IEP goals, or district curriculum mapping tools.
How to Use It
Deploy this worksheet after direct instruction on the constant of proportionality to solidify conceptual understanding. During partner work, observe whether students calculate single ratios or verify that every row maintains a constant y/x value. The activity also functions effectively as a post-lesson formative check or targeted homework assignment, requiring approximately 30 to 45 minutes to complete.
Who It's For
This worksheet serves general education Grade 7 math classrooms, accelerated Grade 6 learners, and Tier 2 intervention groups targeting ratio reasoning. Provide struggling students with a calculation frame for checking equivalent ratios, while advanced learners explore the algebraic proofs in Part B. Pair this document with an anchor chart comparing linear graphs passing through the origin versus nonproportional lines.
According to Fisher & Frey (2014), structured opportunities for students to evaluate mathematical claims and justify their reasoning promote deeper retention of abstract principles. This Grade 7 worksheet addresses standard 7.RP.A.2 by requiring learners to decide whether two quantities represent a proportional relationship through rigorous ratio analysis and algebraic proof. Students examine data tables, test constant unit rates, critique incomplete verification methods, and construct mathematical counterexamples. By evaluating contextual models alongside geometric formulas, learners master the distinction between constant rates of change and true proportionality. The resource provides 8 structured tasks with a full 2-page answer key, establishing clear benchmarks for conceptual mastery and analytical writing in middle school mathematics curricula.


