


Views
Downloads
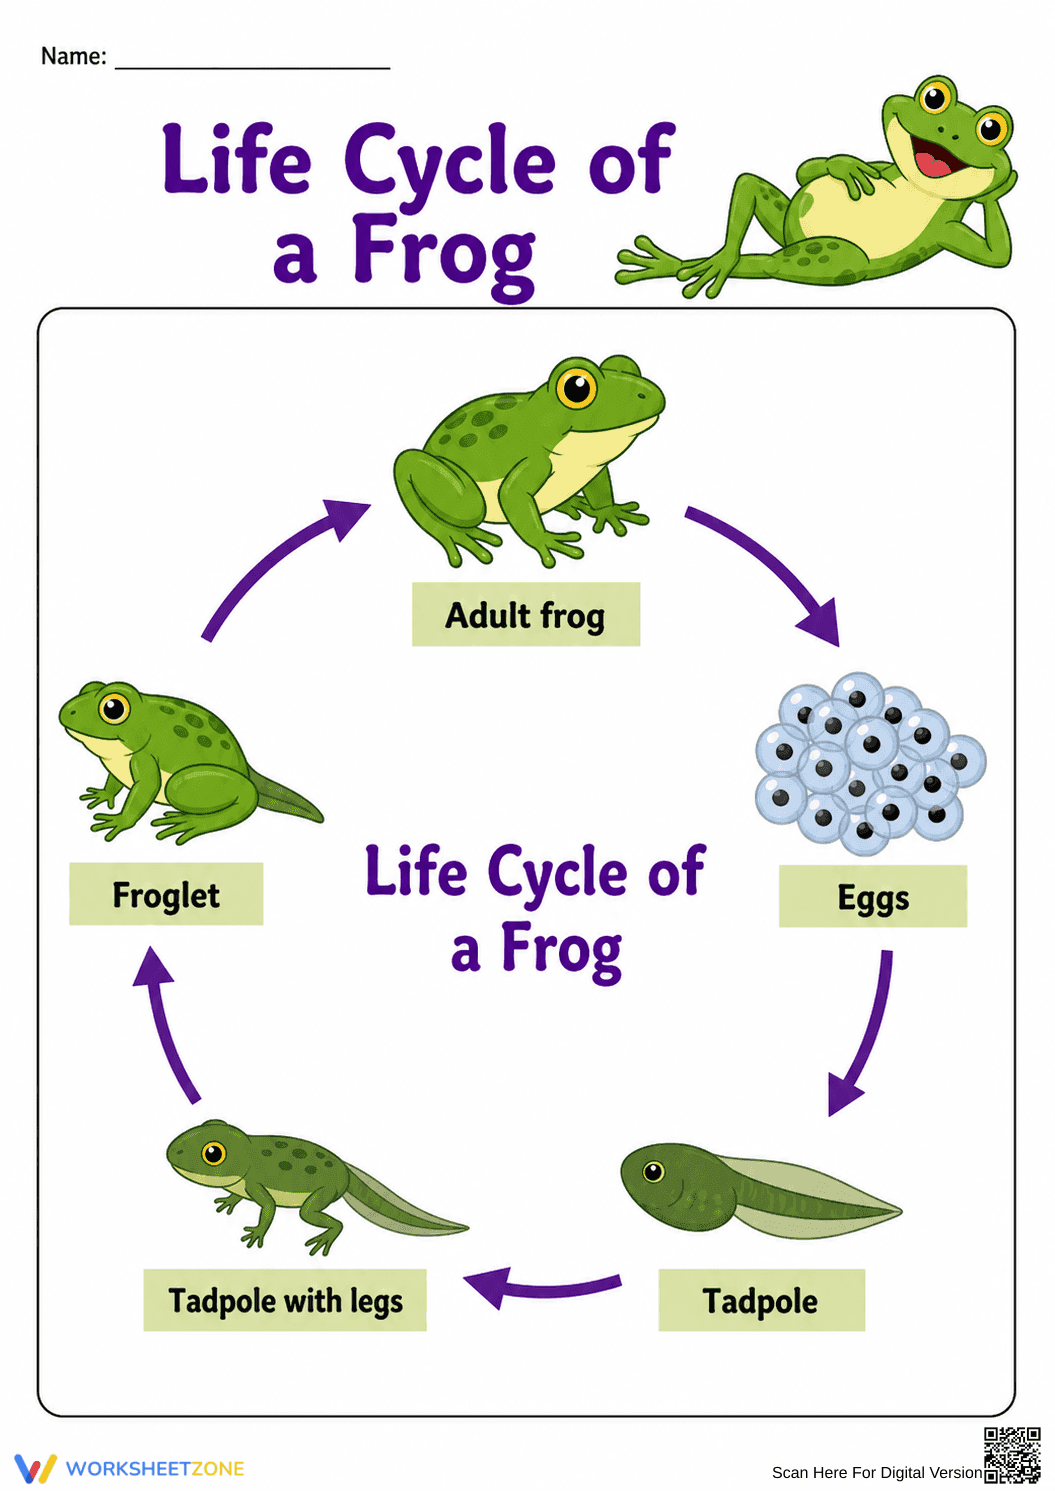
Essential Grade 2 Frog Life Cycle Chart | Printable
Paste this activity's link or code into your existing LMS (Google Classroom, Canvas, Teams, Schoology, Moodle, etc.).
Students can open and work on the activity right away, with no student login required.
You'll still be able to track student progress and results from your teacher account.
This Essential Grade 2 frog life cycle chart provides a vibrant visual model of biological growth and change. Students observe the metamorphosis of a frog across five distinct stages, building foundational science vocabulary and conceptual understanding. By picturizing these transitions, learners can effectively categorize living things and describe the unique life cycles found in nature.
At a Glance
- Grade: 2 · Subject: Living Things
- Standard:
2-LS4-1— Observe and compare animal diversity through developmental stages- Skill Focus: Metamorphosis and Life Cycle Stages
- Format: 1 page · 5 visual stages · Answer key included · PDF
- Best For: Science centers and visual reference guides
- Time: 5–10 minutes
What's Inside
Inside this resource is a professionally illustrated 1-page chart of a frog's life cycle. The diagram labels five stages: Eggs, Tadpole, Tadpole with legs, Froglet, and Adult frog. Circular arrows demonstrate the continuous nature of biological cycles. This visual aid is optimized for printing, ensuring transformation details are visible to young learners.
Zero-Prep Workflow
The zero-prep workflow maximizes instructional time. Teachers can print the guide in under 30 seconds, providing an immediate visual anchor. Distributing the chart takes less than a minute, and the diagram allows for instant engagement. Total teacher preparation time is less than 2 minutes, making it ideal for busy classrooms or substitute plans.
Standards Alignment
This resource aligns to `2-LS4-1`, requiring students to observe animals to compare life diversity. By focusing on metamorphosis, the chart supports `3-LS1-1` regarding unique life cycles. Both standard codes can be copied directly into lesson plans, IEP goals, or district curriculum mapping tools.
How to Use It
Use this chart as a primary visual model for metamorphosis. Before a unit, display it to brainstorm amphibian knowledge. For a formative assessment tip, ask students to identify the stage where the animal transitions from water to air breathing. This activity takes 10–15 minutes of classroom discussion.
Who It's For
This chart is for Grade 2 but suits K-3 learners. It serves as a differentiation tool for English Language Learners and students with IEPs who need visual supports. Pair this with a pond habitat reading or a lesson on vertebrate characteristics for a comprehensive experience.
This Grade 2 Science chart on the life cycle of a frog serves as a rigorous model for teaching metamorphosis within the framework of 2-LS4-1. By identifying five distinct developmental stages—Eggs, Tadpole, Tadpole with legs, Froglet, and Adult frog—students engage in the core practice of observation required by the NGSS. According to a ScienceDirect TpT Analysis, high-quality visual aids in early elementary science are critical for bridging the gap between abstract biological concepts and physical reality. The chart facilitates the identification of patterns in animal growth, a key crosscutting concept. Educators can confidently integrate this resource into curriculum maps focused on the diversity of living things. This printable guide ensures that the specific skill of sequencing life stages is mastered through clear, evidence-based visual representation.