


























Views
Downloads



Essential Limiting Factors Worksheet | Grade 9 Biology
Paste this activity's link or code into your existing LMS (Google Classroom, Canvas, Teams, Schoology, Moodle, etc.).
Students can open and work on the activity right away, with no student login required.
You'll still be able to track student progress and results from your teacher account.
This Grade 9 biology worksheet trains students to defend ecological limiting-factor explanations using authentic multi-year field data. High school learners analyze population shifts across riparian species, differentiate density-dependent from density-independent mechanisms, and evaluate competing ecological claims to demonstrate a thorough understanding of ecosystem carrying capacity.
At a Glance
- Grade: 9 · Subject: Biology
- Standard: High School Life Sciences — Construct explanations based on evidence for how limiting factors affect populations
- Skill Focus: Defend a Limiting-Factor Explanation
- Format: 5 pages · 8 problems · Answer key included · PDF
- Best For: High school ecology data analysis
- Time: 45–60 minutes
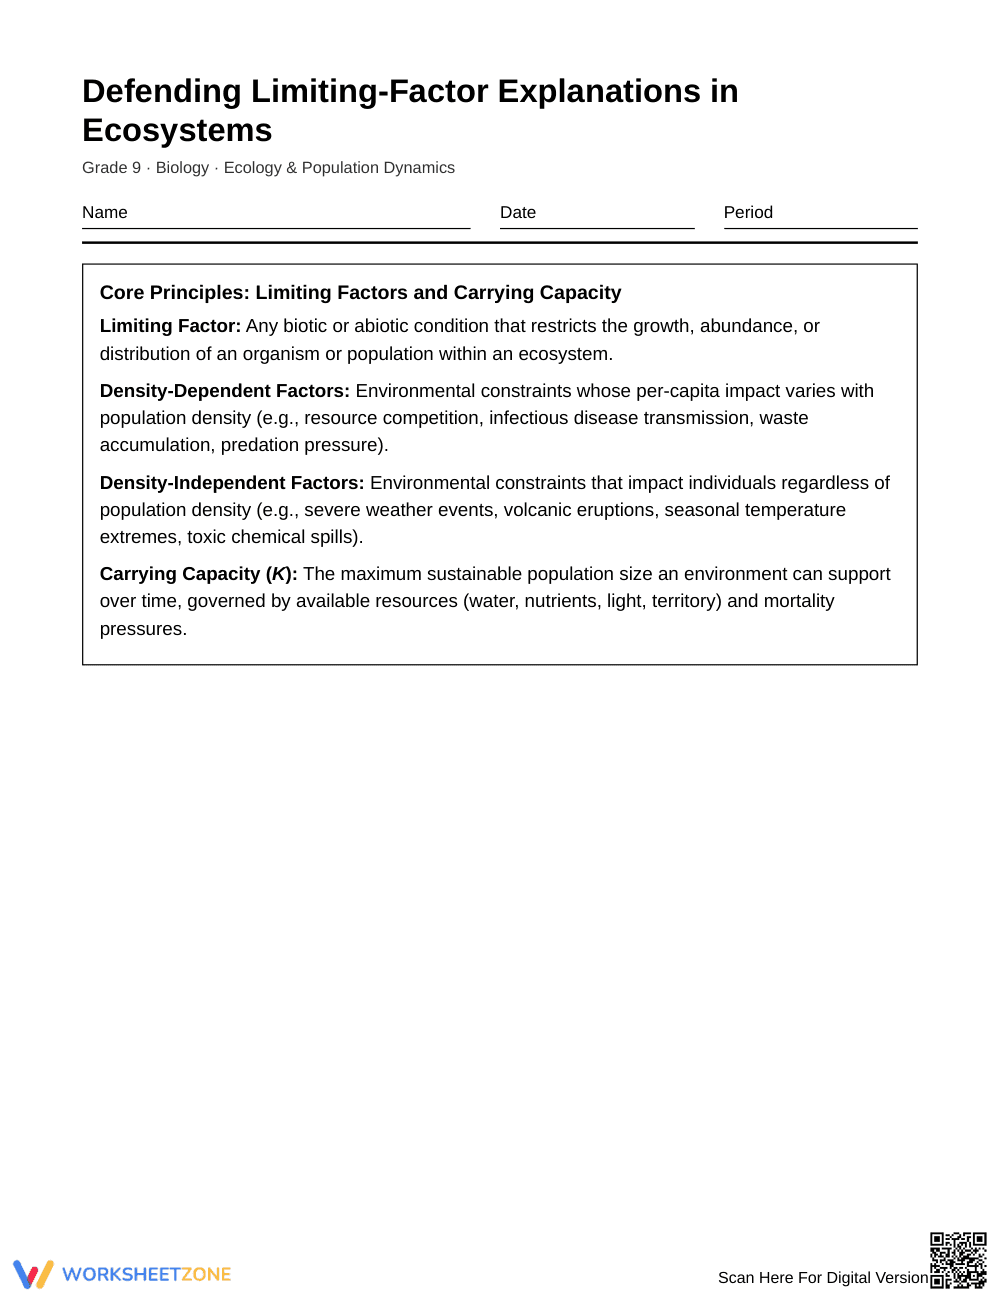
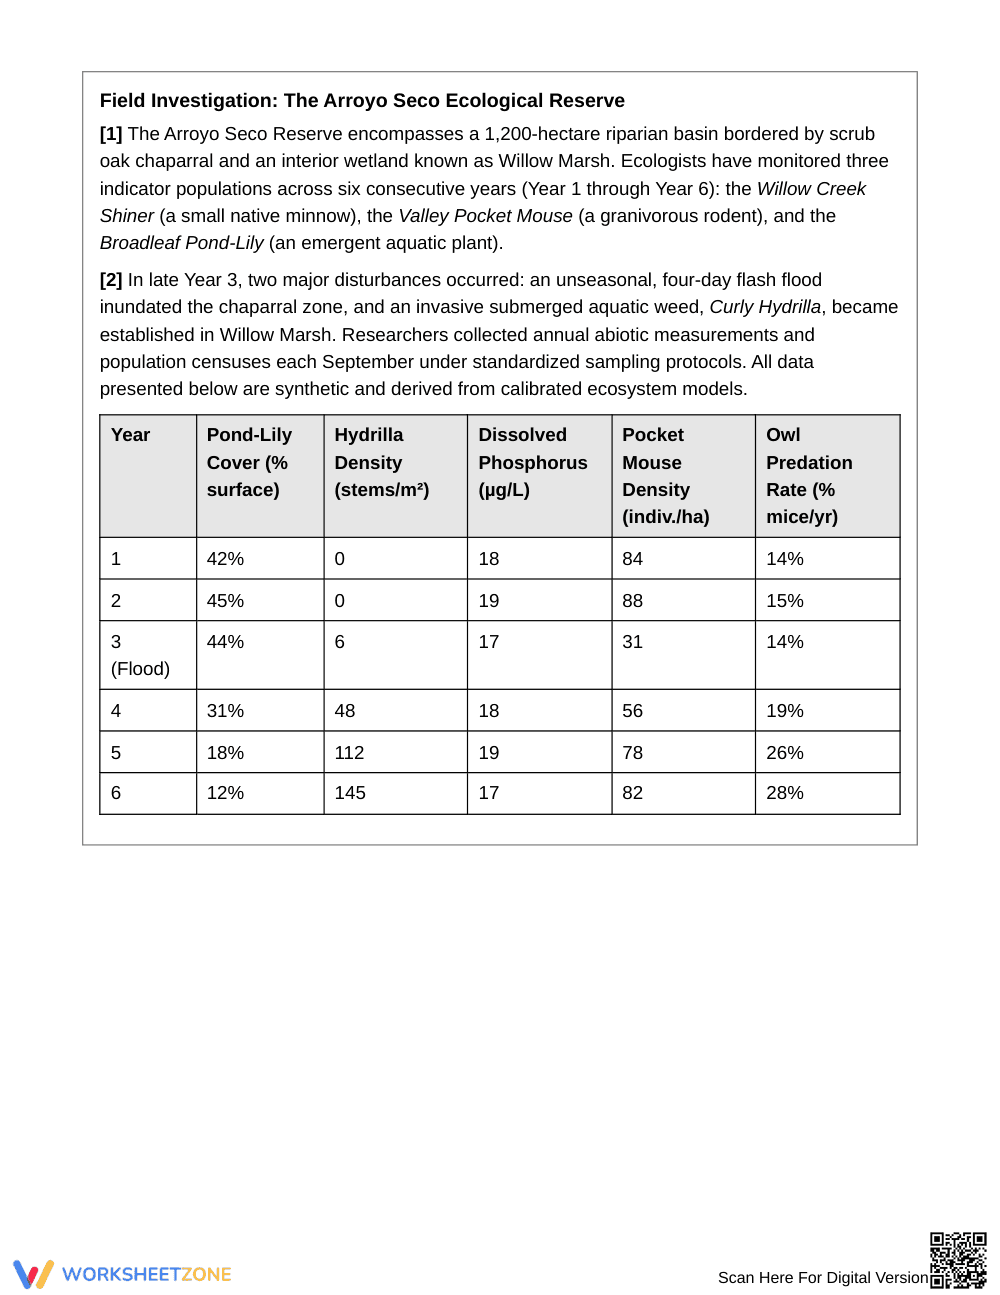
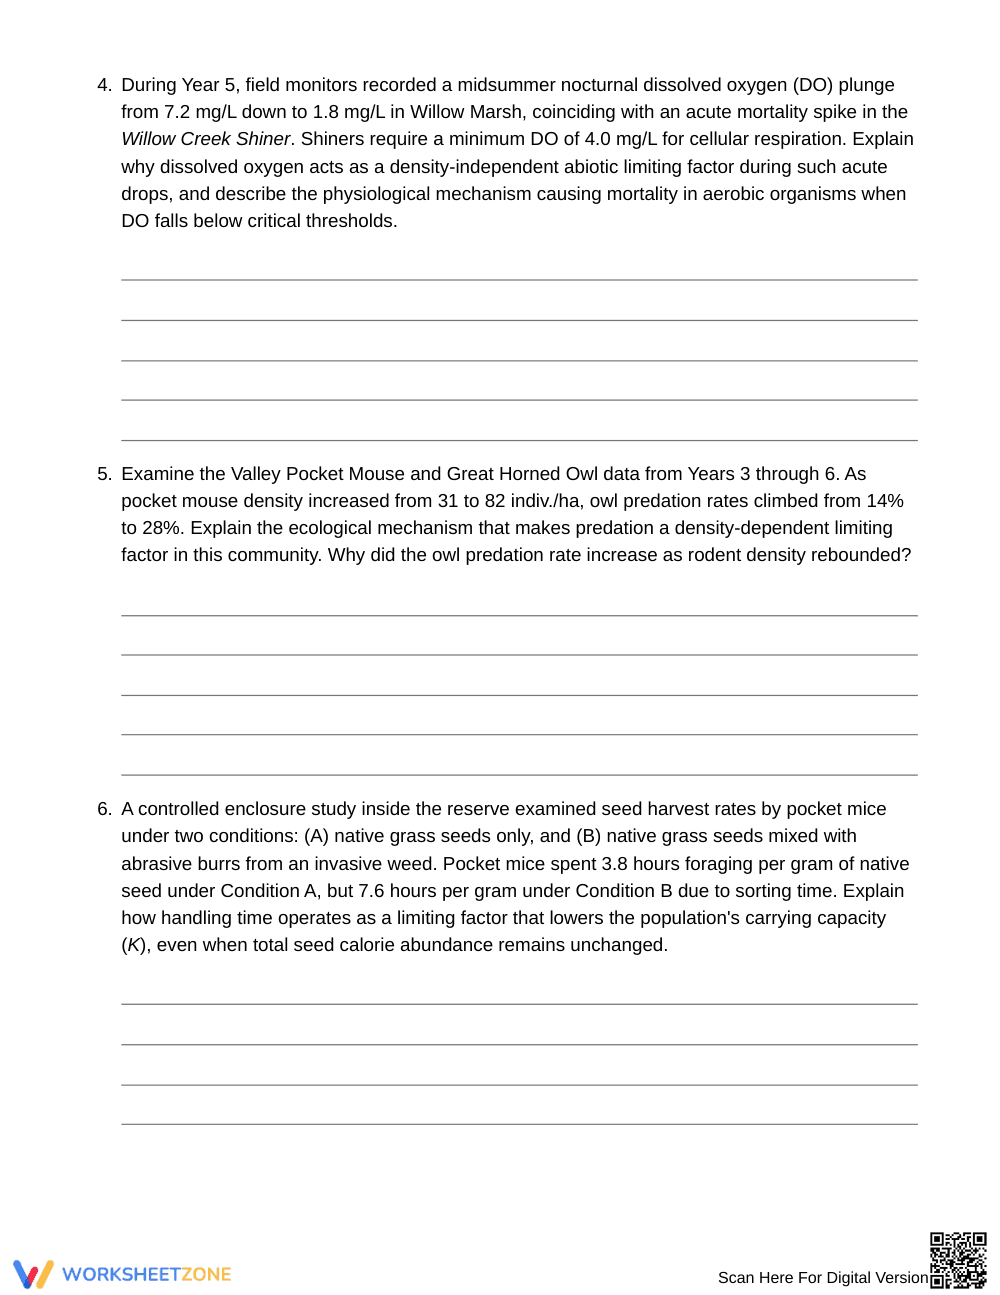
The 5-page investigation opens with a reference box defining carrying capacity and environmental constraints. Students analyze a standardized 6-year reserve dataset tracking aquatic plants, invasive Hydrilla, water chemistry, pocket mice, and owl predation across 8 tasks. Activities include evidence identification, causal physiological explanations, and scientific claim rebuttals. A 3-page answer key provides thorough model answers.
Skill Progression
- Guided practice (Part A, 2 problems): Students isolate empirical data points from the table to refute nutrient deficiency claims and classify acute mortality events.
- Supported practice (Part B, 4 problems): Learners construct multi-step scientific explanations connecting competition, oxygen depletion, and predator functional responses to cellular and community mechanisms.
- Independent practice (Part C, 2 problems): High schoolers independently evaluate conflicting hypotheses using quantitative reasoning and draft a rebuttal against proposed habitat disruption.
This sequence follows a gradual-release instructional model that transitions students from evidence identification to autonomous scientific argumentation.
Standards Alignment
High school life science standards require students to construct explanations based on evidence for how resource availability influences carrying capacity and population sizes within ecosystems. This investigation targets these expectations by demanding empirical defense rather than superficial recall of ecological terms. Both standard codes can be copied directly into lesson plans, IEP goals, or district curriculum mapping tools.
How to Use It
Assign this worksheet after direct instruction on population dynamics as an in-depth lab activity or summative evaluation. Alternatively, use Parts A and B for guided practice, reserving Part C for a partner challenge. Formative assessment tip: verify whether students identify the Year 3 mouse crash as a density-independent flood event rather than predation. Completion takes 45 to 60 minutes.
Who It's For
This resource serves general Grade 9 Biology, Honors Biology, and environmental science students. The foundational vocabulary box supports accessible data analysis for diverse learners. Pair this activity with a population curve graphing exercise or a predator-prey simulation lab.
Defending limiting-factor explanations with quantitative ecosystem data represents a cornerstone of secondary science literacy. According to findings documented in the RAND AIRS 2024 report on secondary science instructional effectiveness, regular student engagement with multi-variable datasets and claim evaluation substantially strengthens empirical reasoning and mechanistic explanation skills among high school biology students. By analyzing 6 consecutive years of calibrated field metrics from the Arroyo Seco Ecological Reserve, students move far beyond rote memorization of abiotic definitions. They systematically evaluate competing scientific claims regarding carrying capacity, identify density-independent disruptions like flash floods, and trace complex physiological causal pathways such as dissolved oxygen depletion in aquatic organisms. This structured analytical practice equips ninth-grade learners to interpret ecological interactions with scientific rigor, defensible evidence selection, and high data fidelity across diverse secondary biology units and standardized state science assessments.


