


























Views
Downloads


Essential Density Dependence Worksheet | Grade 10 Biology
Paste this activity's link or code into your existing LMS (Google Classroom, Canvas, Teams, Schoology, Moodle, etc.).
Students can open and work on the activity right away, with no student login required.
You'll still be able to track student progress and results from your teacher account.
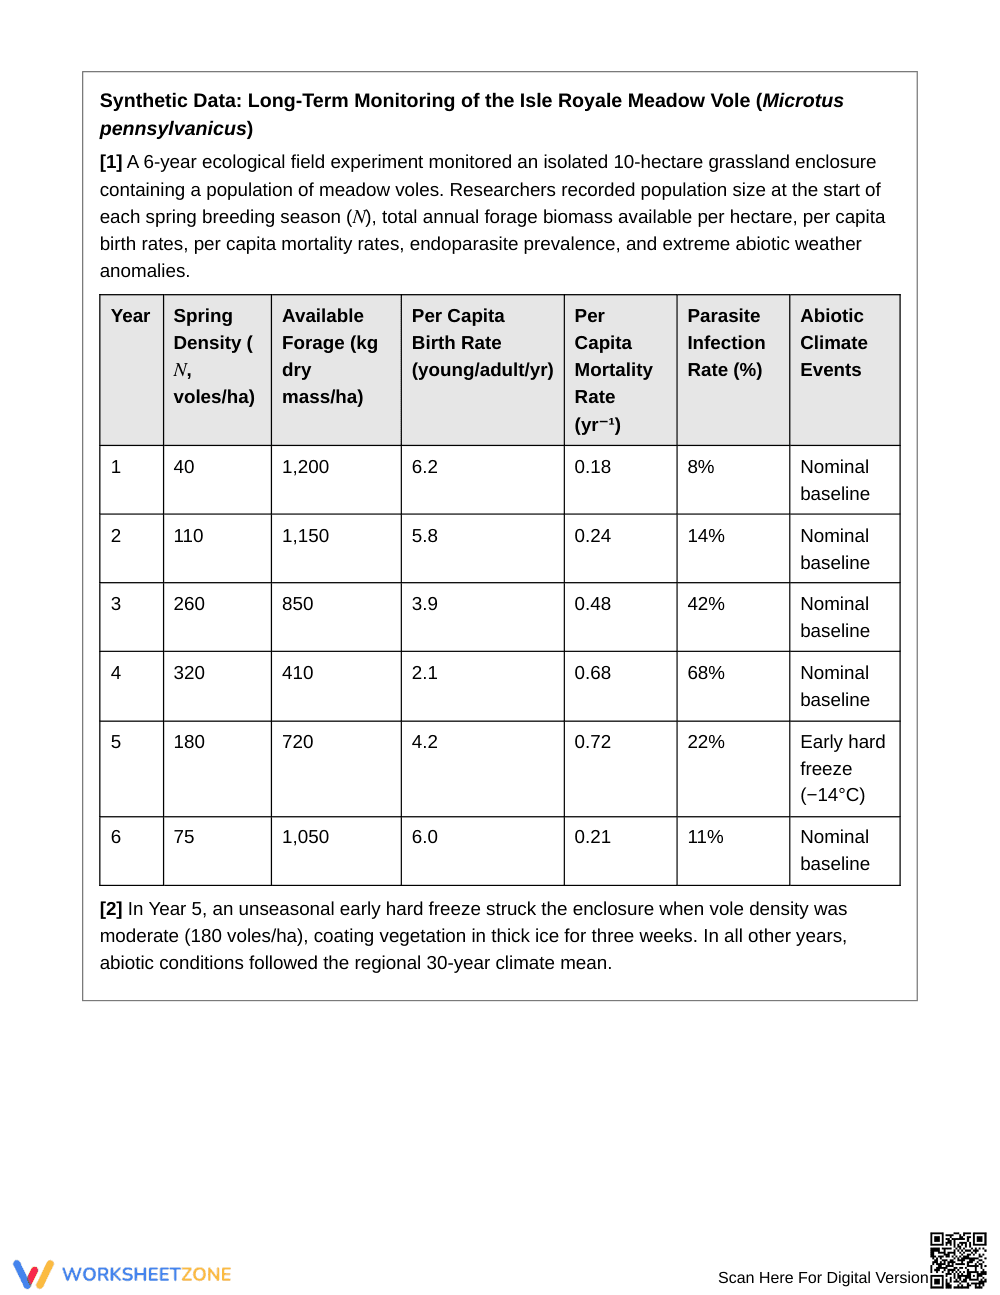
This high school biology worksheet trains students to defend density-dependent population models using empirical demographic data. Grade 10 learners analyze a 6-year meadow vole enclosure study, isolating per capita birth and death rates to distinguish density-dependent resource competition from density-independent weather anomalies while evaluating carrying capacity dynamics.
At a Glance
- Grade: 10 · Subject: Biology
- Standard: Evaluate evidence showing how density-dependent factors regulate carrying capacity and population size
- Skill Focus: Defending Density-Dependent Population Models Using Empirical Data
- Format: 5 pages · 8 problems · Answer key included · PDF
- Best For: High school population ecology, modeling, and data analysis
- Time: 45–60 minutes
What's Inside
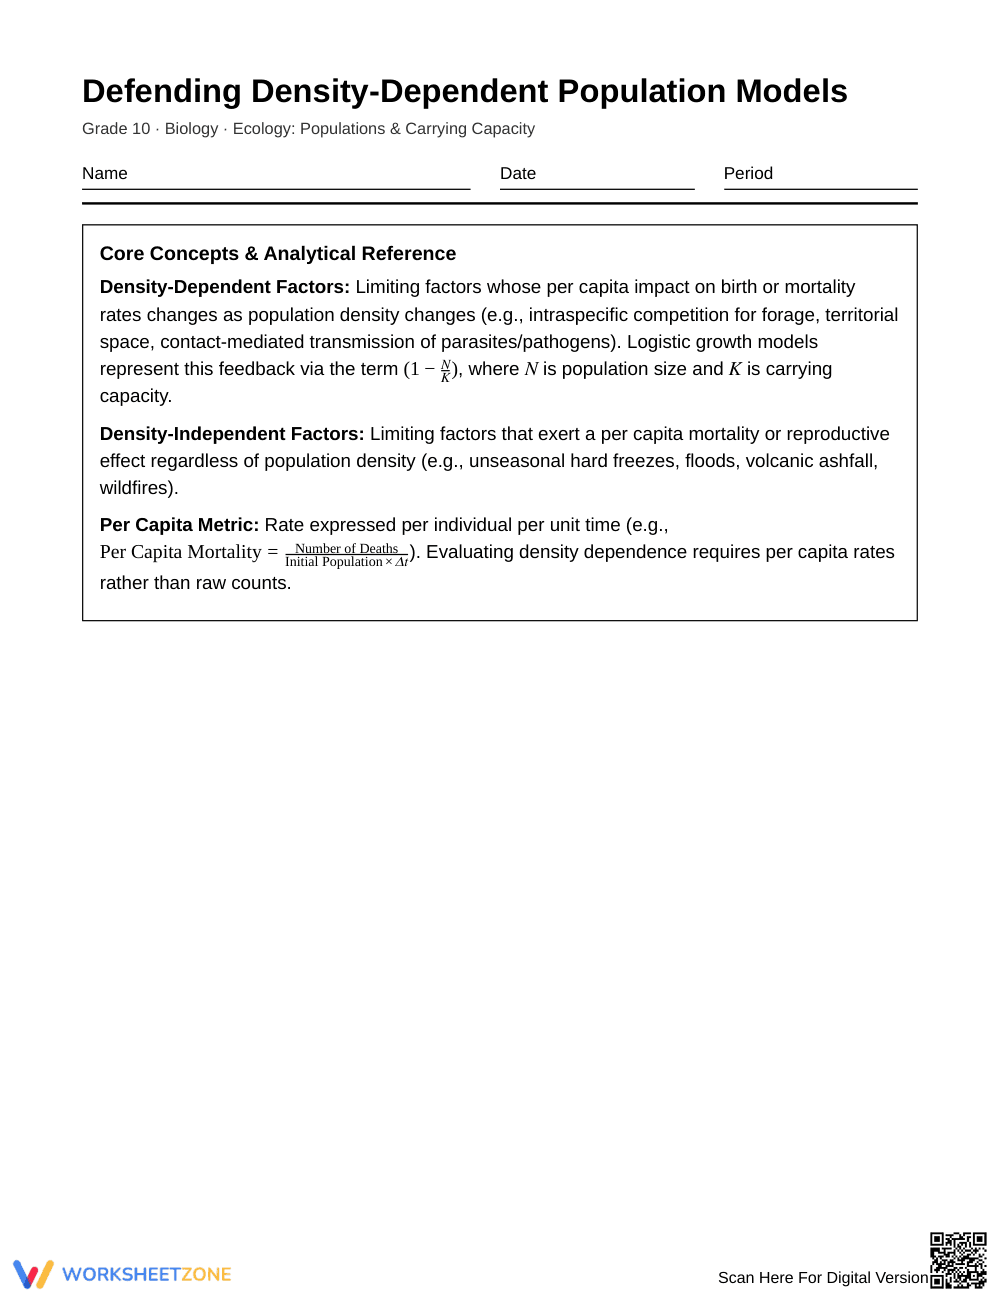
This 5-page printable resource includes an analytical concept reference box, a comprehensive 6-year demographic data table on meadow voles, and 8 structured analytical prompts. The introductory reference box defines per capita rates and the logistic growth term (1−N/K). Students evaluate empirical trends, generate physiological mechanisms for birth declines, and critique flawed claims. A detailed 4-page answer key provides complete model explanations and data citations.
Skill Progression
- Guided practice (Part A — 2 tasks): Students identify empirical trends in the vole table, isolating per capita birth and mortality rates to distinguish density dependence from weather anomalies.
- Supported practice (Part B — 4 tasks): Learners construct physiological mechanisms linking high density to forage depletion, parasite loading, and the logistic term (1−N/K).
- Independent practice (Part C — 2 tasks): Students refute competing alternative claims, demonstrating why raw mortality counts fail to prove density dependence compared to per capita metrics.
This sequence implements a gradual-release model, moving students from guided data isolation to autonomous scientific critique.
Standards Alignment
This worksheet aligns with high school biology ecology standards: Use mathematical and computational representations to support explanations of factors that affect carrying capacity of ecosystems at different scales. Supporting standards address evaluating evidence and constructing scientific arguments from empirical datasets. Both standard codes can be copied directly into lesson plans, IEP goals, or district curriculum mapping tools.
How to Use It
Assign this worksheet after direct instruction on population growth curves and carrying capacity. For collaborative practice, have student pairs complete Parts A and B to analyze per capita rates and discuss physiological mechanisms. Use Part C as an individual check for understanding to assess argument defense. As a formative assessment tip, check whether students analyze per capita rates rather than raw deaths in Year 5. Completion takes 45 to 60 minutes.
Who It's For
This activity is designed for Grade 10 Biology students investigating ecosystem dynamics. For struggling learners, provide an anchor chart defining per capita calculations. Advanced learners can mathematically calculate carrying capacity shifts across years. Pair this resource with a population growth graphing lab.
This Grade 10 population ecology worksheet develops student mastery of defending density-dependent population models and analyzing carrying capacity dynamics. High school biology curricula require students to interpret empirical evidence and formulate mechanistic explanations showing how density-dependent limiting factors regulate natural populations. According to Fisher & Frey (2014), structured argumentation and gradual-release scaffolds significantly strengthen secondary students' capacity to interpret complex quantitative datasets and evaluate competing scientific hypotheses. Across 8 rigorous tasks, students examine long-term demographic data from meadow vole populations, contrasting per capita mortality rates against density-independent climate events. By resolving common misconceptions regarding raw death counts versus proportional per capita metrics, students demonstrate robust ecological reasoning aligned with standard high school biology expectations. This self-contained five-page instructional resource equips secondary science educators with classroom-ready data analysis, student-facing reference summaries, and a comprehensive four-page answer key designed for immediate instructional use.


