


























Views
Downloads

Complete Trait Time Series Worksheet | Grade 10 Biology
Paste this activity's link or code into your existing LMS (Google Classroom, Canvas, Teams, Schoology, Moodle, etc.).
Students can open and work on the activity right away, with no student login required.
You'll still be able to track student progress and results from your teacher account.
This microevolution analysis worksheet equips students to evaluate authentic ecological time series data and differentiate between natural selection, genetic drift, and gene flow. Through ten data-rich prompts, high school learners connect selective pressures with multi-generational trait shifts, building the quantitative reasoning skills essential for high school biology mastery.
At a Glance
- Grade: 10 · Subject: Biology
- Standard: Analyze data to support explanations for microevolutionary changes over time
- Skill Focus: Analyzing trait and environmental time series
- Format: 5 pages · 10 problems · Answer key included · PDF
- Best For: Microevolution unit assessment or review
- Time: 45–60 minutes
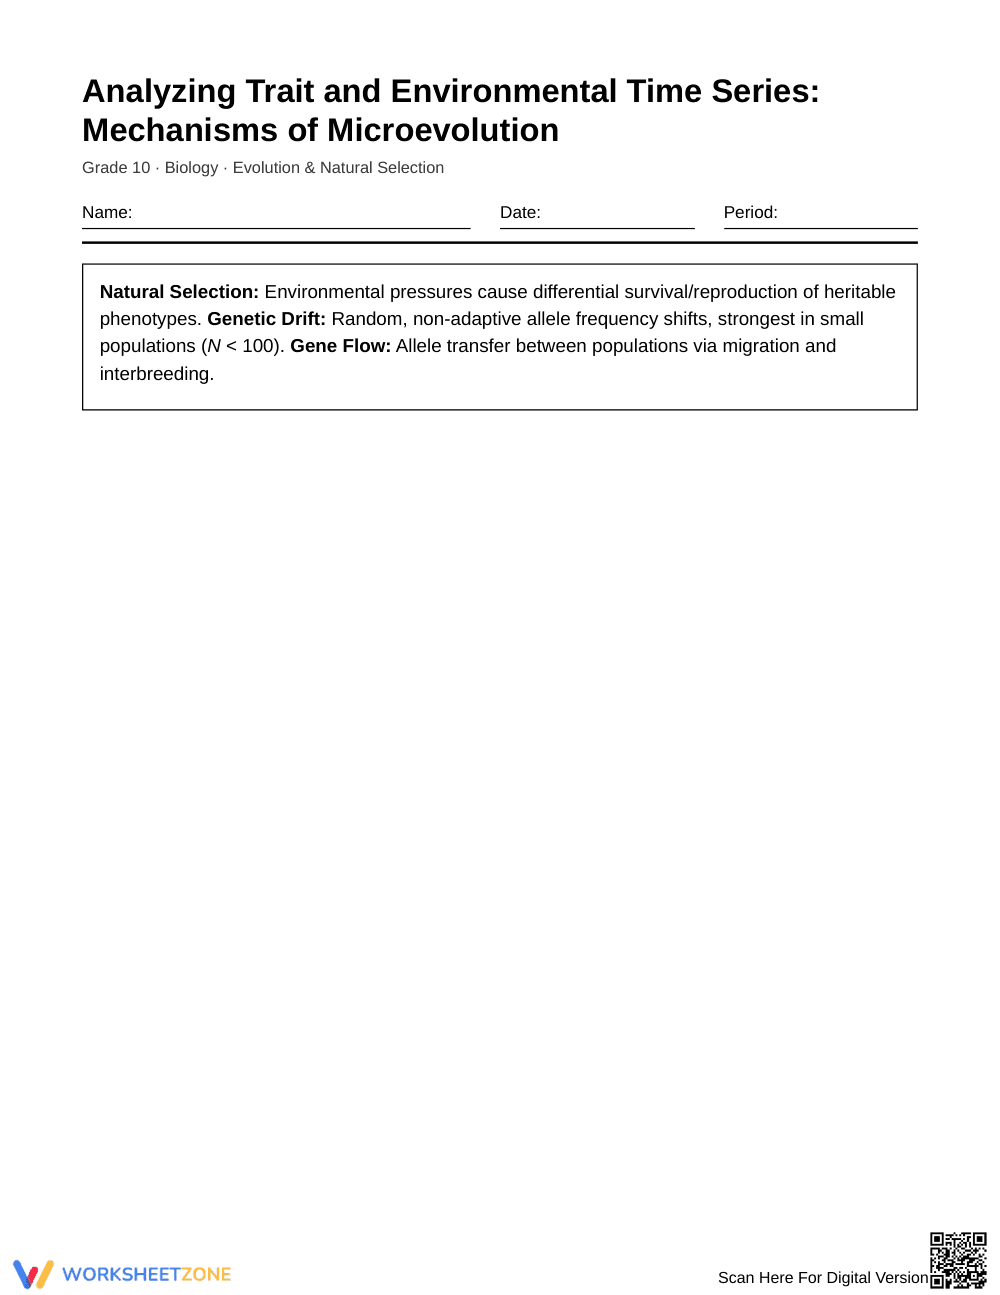
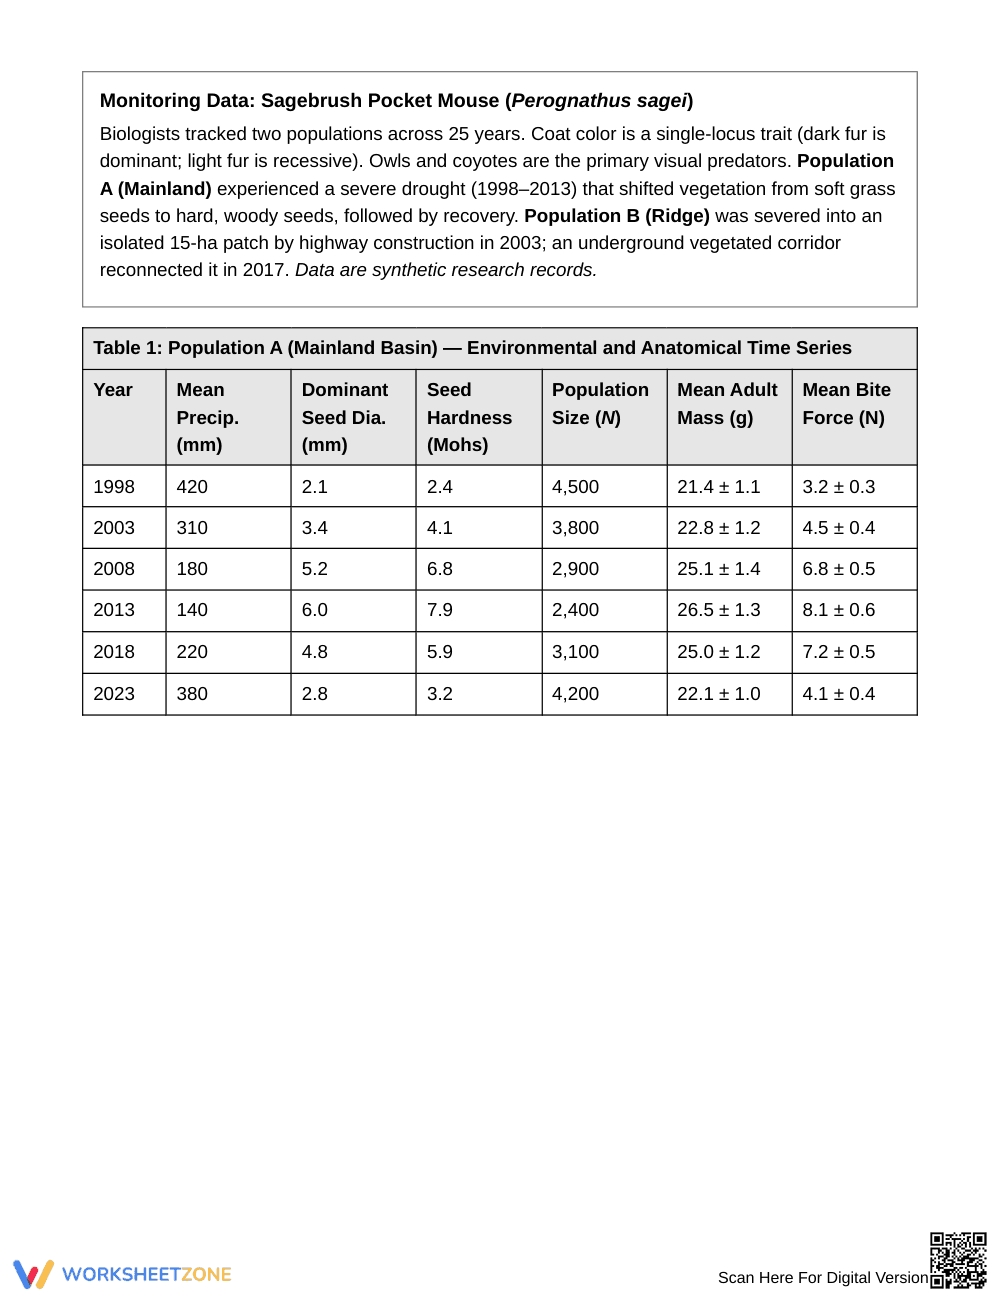
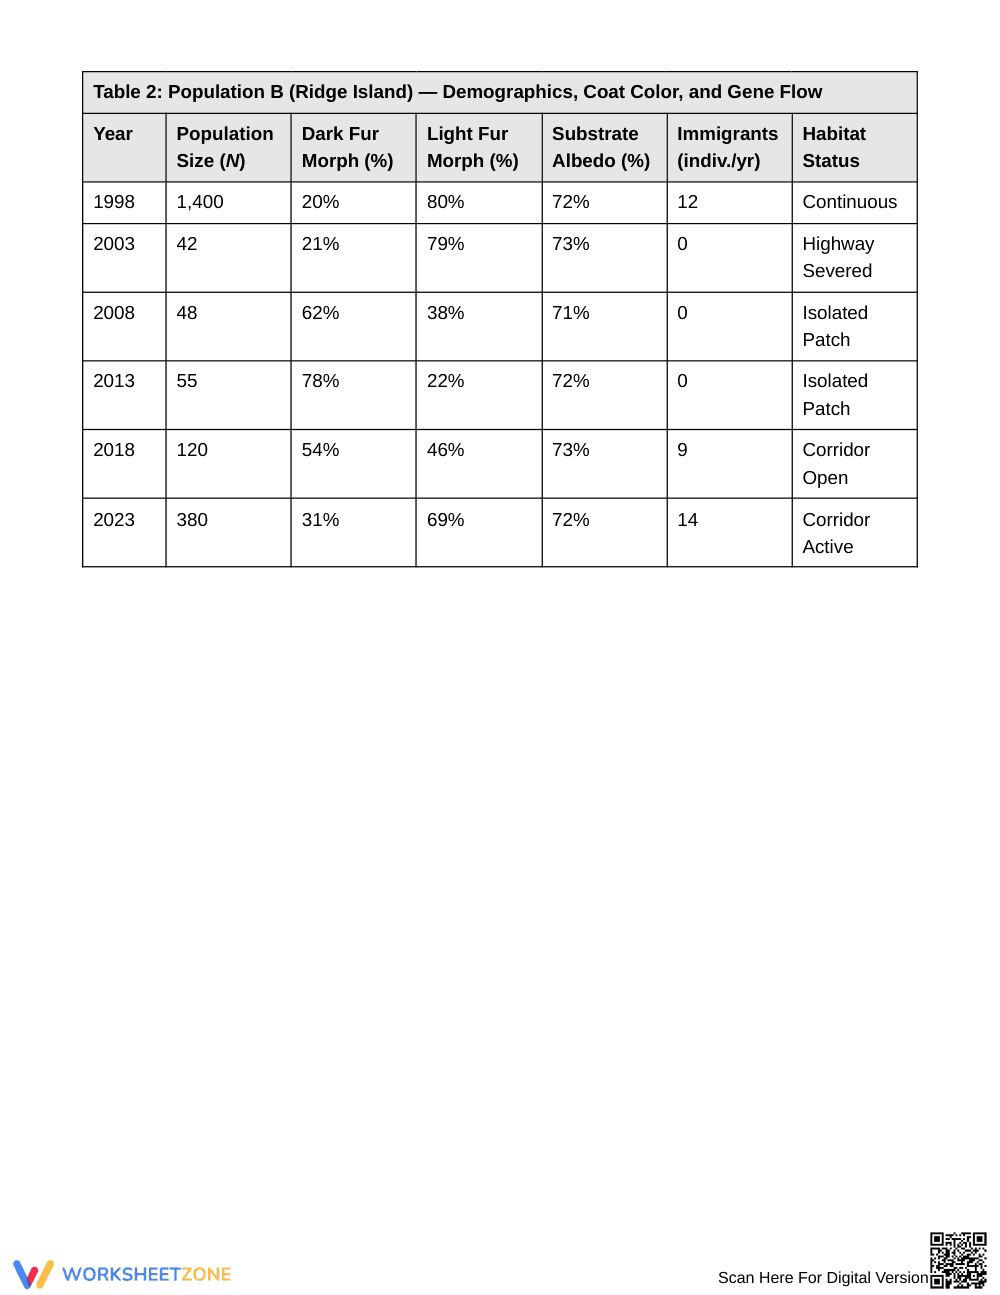
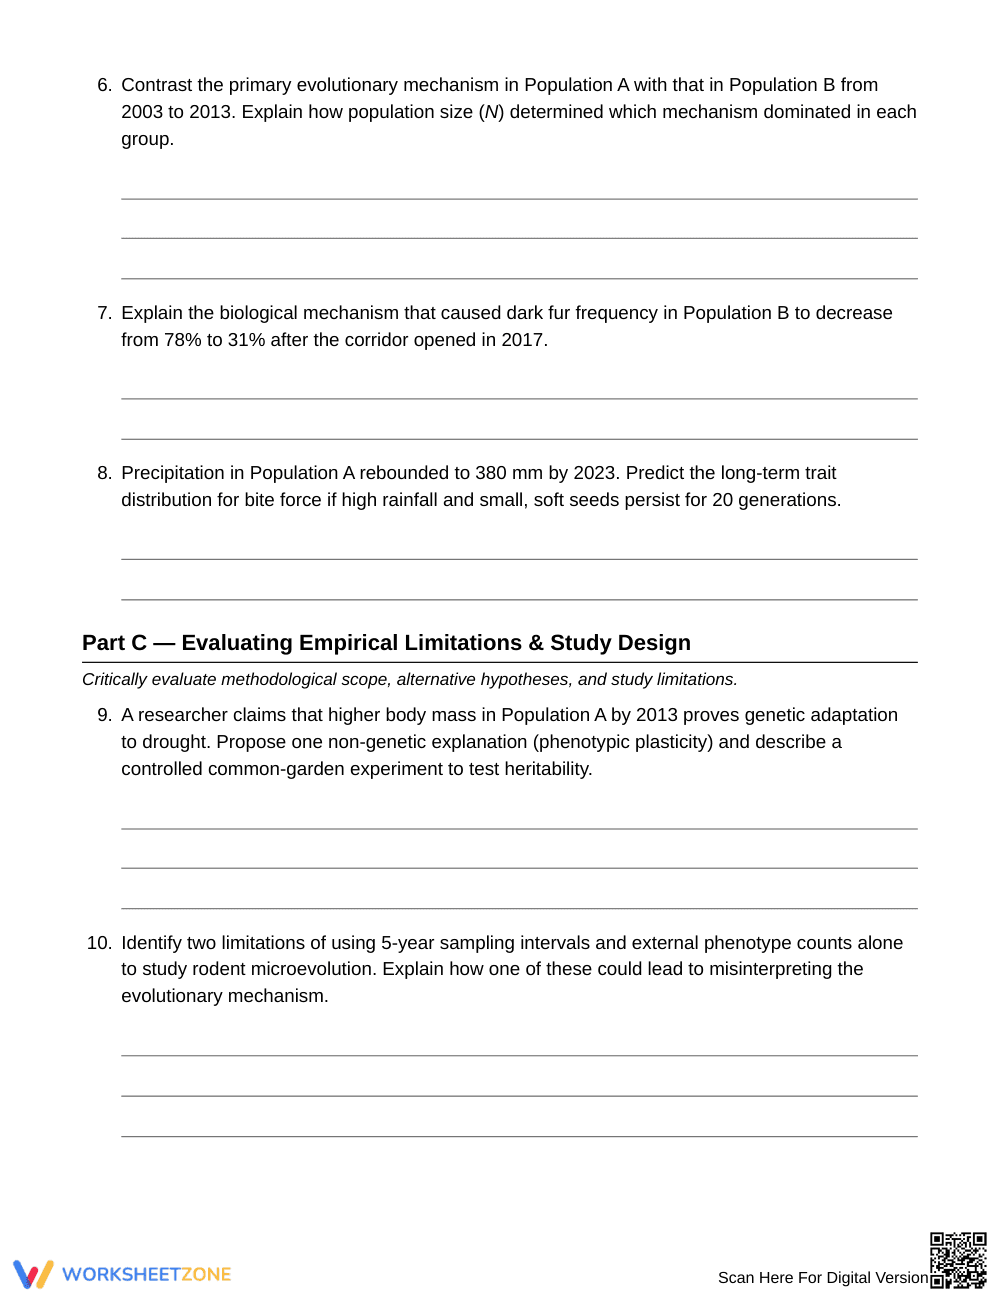
Students explore longitudinal monitoring data for two sagebrush pocket mouse populations across a 25-year timeline. The worksheet features an introductory concept summary defining primary evolutionary mechanisms, two detailed data tables linking environmental shifts to morphological traits, ten analytical prompts across three structured parts, and a comprehensive two-page teacher answer key.
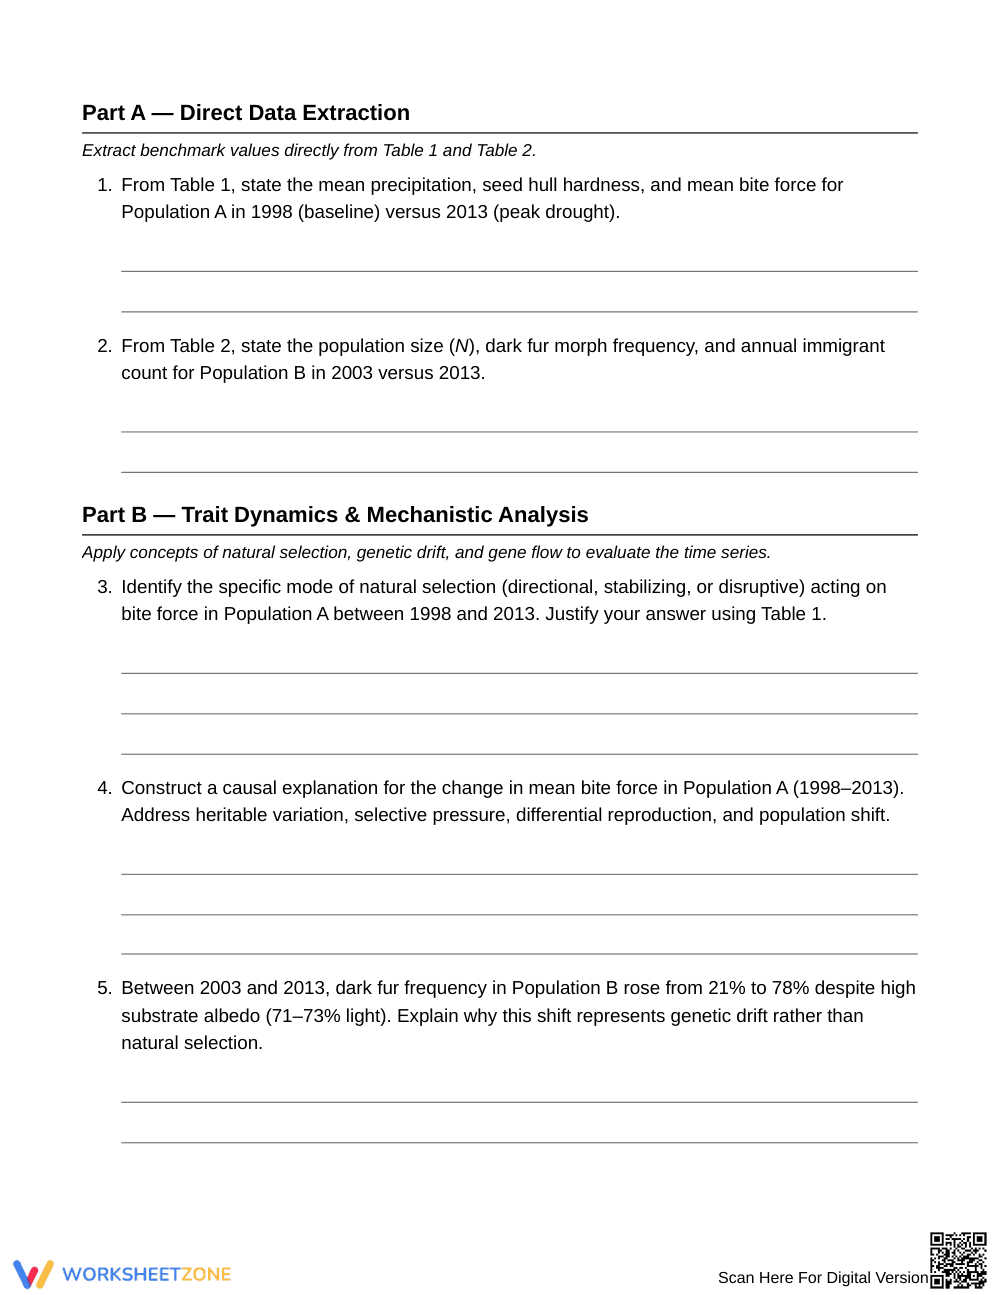
- Guided practice (Part A, 2 tasks): Low scaffold support; learners extract quantitative baseline metrics, population counts, and phenotypic frequencies directly from environmental and anatomical monitoring tables.
- Supported practice (Part B, 6 tasks): Intermediate scaffold support; students apply conceptual models to classify selection modes, diagnose genetic drift, and explain gene flow dynamics.
- Independent practice (Part C, 2 tasks): High cognitive demand; learners evaluate methodological design, propose experimental controls for phenotypic plasticity, and critique long-term sampling limitations.
This sequence embodies the gradual release of responsibility model, guiding students from objective data identification to independent scientific argumentation and experimental design critique.
Aligned with core high school life science standards for biological evolution, this resource asks students to construct explanations based on empirical evidence for how natural selection leads to adaptation. Students also analyze how genetic drift and migration alter allele distributions in response to environmental disturbances. Both standard concepts can be copied directly into lesson plans, IEP goals, or district curriculum mapping tools.
Deploy this worksheet after direct instruction on evolutionary mechanisms to reinforce evidence-based scientific claims. During paired analysis, check Part B to confirm students distinguish between drift in small isolated populations and adaptive selection. Alternatively, assign this 5-page packet across 45 to 60 minutes as a summative assessment following a genetics unit.
This packet is designed for Grade 10 biology students mastering ecological genetics and population dynamics. For emerging bilingual learners or students needing additional support, provide highlighters to track table columns across time steps. Pair this investigative task directly with an allele frequency simulation or an anchor chart detailing natural selection curves.
According to EdReports 2024, high-quality high school science instructional resources must move beyond rote memorization by requiring students to analyze authentic time-series data and formulate evidence-based mechanistic explanations. This Grade 10 biology resource directly reflects those findings by presenting multi-decade ecological records that require active quantitative reasoning and conceptual synthesis. Rather than treating microevolution as an abstract principle, students actively track morphological trait shifts alongside environmental variables across 25 years, disentangling adaptive natural selection from non-adaptive genetic drift and migration-driven gene flow. Rigorous scientific literacy develops when learners confront empirical ambiguity, control for non-genetic phenotypic plasticity, and evaluate the trade-offs of real-world ecological sampling frequencies. Incorporating this structured ten-task data investigation ensures students cultivate the scientific argumentation, critical thinking, and graphical interpretation skills emphasized in contemporary secondary science performance expectations.


