


























Complete Population Change Worksheet | Grade 9 Biology
Paste this activity's link or code into your existing LMS (Google Classroom, Canvas, Teams, Schoology, Moodle, etc.).
Students can open and work on the activity right away, with no student login required.
You'll still be able to track student progress and results from your teacher account.
This comprehensive Grade 9 population dynamics worksheet equips high school biology students to calculate, model, and trace the net effects of births, deaths, immigration, and emigration on ecological populations. Students apply demographic equations to real-world conservation data, determine population growth trajectories, and evaluate complex environmental scenarios through quantitative reasoning and biological analysis.
At a Glance
- Grade: 9 · Subject: Biology
- Standard: Calculate demographic rates to predict ecosystem population shifts
- Skill Focus: Population dynamics, net change equations, and migration modeling
- Format: 5 pages · 10 problems · Answer key included · PDF
- Best For: High school ecology and population units
- Time: 40–50 minutes
What's Inside
This 5-page printable instructional packet features 10 multi-part analytical questions paired with a 3-page complete answer key containing worked mathematical solutions. The resource opens with an explicit demographic formula reference box and synthetic modeling cases, guiding students through event classification tables, tabular multi-zone census calculations, multiple-choice predictive scenarios, and open-ended causal chain explanations.
Skill Progression
- Guided Practice: Tasks 1–3 provide structured data tables where students classify demographic events as additions or losses, calculate net herd change, and explain counterintuitive population declines.
- Supported Practice: Tasks 4–8 present multi-step reserve monitoring data, requiring students to compute source-sink dynamics, evaluate environmental stress combinations, determine percentage loss, and calculate equilibrium birth requirements.
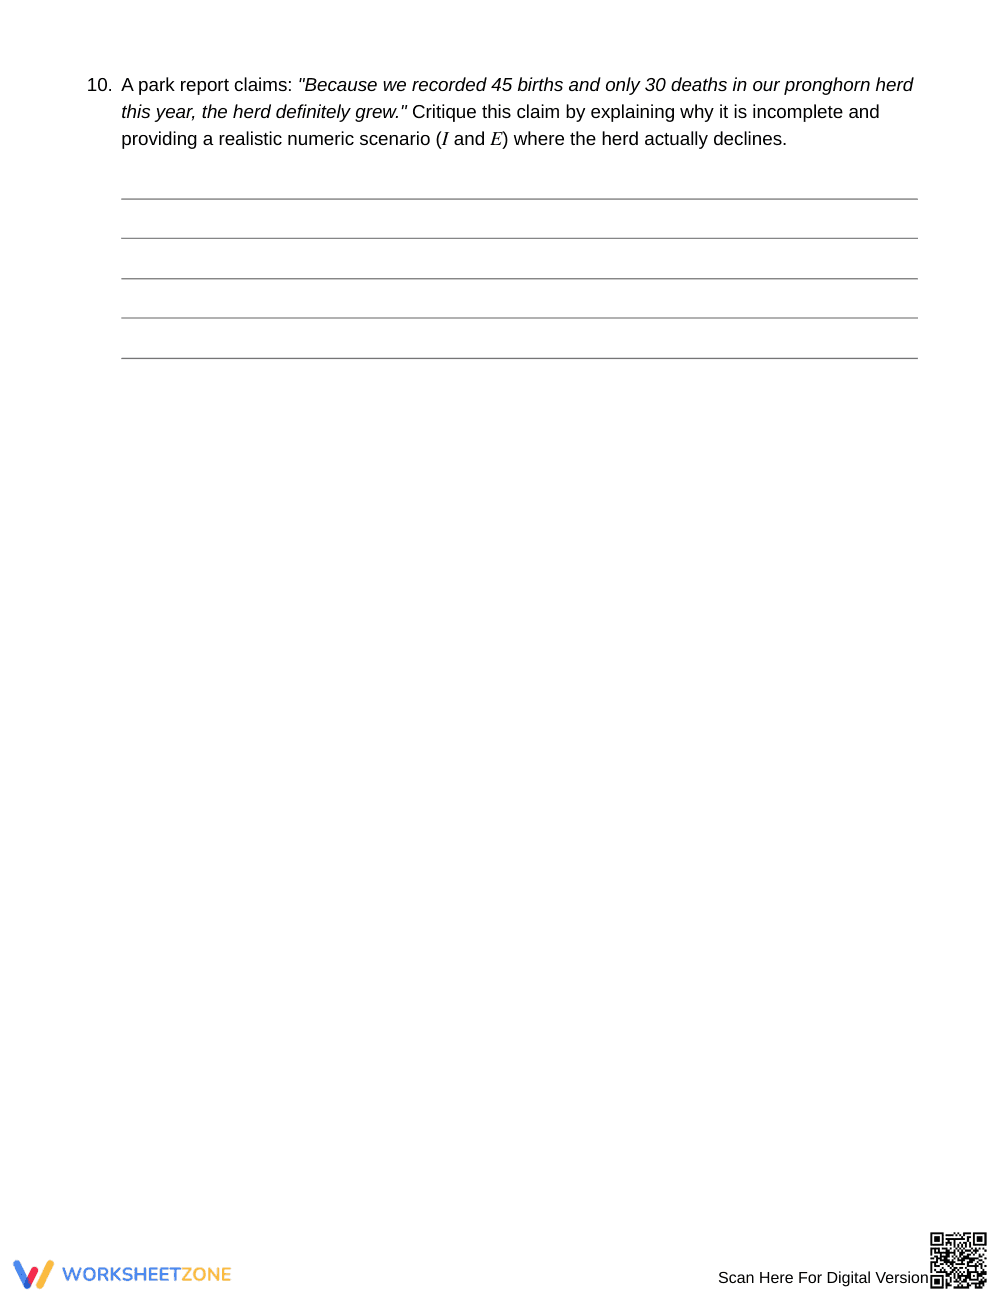
- Independent Practice: Tasks 9–10 challenge students to independently trace ecological causal chains following resource pulses and critique flawed demographic claims with original counter-models.
This sequence embodies the gradual-release framework, moving learners systematically from computational modeling to independent biological critique.
Standards Alignment
This instructional activity directly aligns with high school life science standards targeting the mathematical modeling of carrying capacity, resource constraints, and ecosystem interactions. Students use quantitative representations to demonstrate how interdependent factors alter population size over time. This targeted problem set can be copied directly into lesson plans, IEP goals, or district curriculum mapping tools.
How to Use It
Assign this resource immediately after direct instruction on ecosystem dynamics as structured in-class practice, or utilize it as a focused review prior to unit assessments. During class, monitor student responses on Task 3 and Task 10 as formative checkpoints to ensure learners distinguish between local vital rates (births and deaths) and spatial movements (immigration and emigration). Expect students to complete all 10 problems within 40 to 50 minutes.
Who It's For
This resource serves general ninth-grade biology students, honors biology cohorts, and environmental science learners needing rigorous quantitative practice. Built-in worked examples provide scaffolding for developing learners, while multi-step reserve scenarios offer extension opportunities. Pair this worksheet directly with your introductory ecology lecture slides or an interactive carrying-capacity graph analysis.
Quantitative literacy in secondary science classrooms requires explicit modeling of ecological equations before learners can successfully interpret complex ecosystem disruptions. According to Fisher & Frey (2014), structured instructional progressions that bridge scaffolded mathematical computation and independent causal explanation produce measurable gains in scientific reasoning. This 10-task biology resource provides rigorous practice tracing the four core demographic variables across synthetic wildlife censuses, ensuring students master the relationship between vital rates and net population growth. By applying net change calculations across diverse scenarios, high school students develop the conceptual and computational fluency necessary to analyze ecological disturbances, evaluate conservation data, and justify biological claims across standard high school life science curricula.


