


























Views
Downloads



Complete Carrying Capacity Worksheet | Grade 10 Biology
Paste this activity's link or code into your existing LMS (Google Classroom, Canvas, Teams, Schoology, Moodle, etc.).
Students can open and work on the activity right away, with no student login required.
You'll still be able to track student progress and results from your teacher account.
Strengthen ecological modeling skills with this data-driven population dynamics worksheet. Students analyze realistic case studies of elk herds and brook trout populations to evaluate carrying capacity, calculate per-capita resources, and quantify ecological resistance. This resource helps high school biology students connect abiotic disruptions to population changes using quantitative evidence.
At a Glance
- Grade: 10 · Subject: Biology
- Standard: HS-LS2 — Evaluate population dynamics and carrying capacity under shifting resource constraints
- Skill Focus: Carrying Capacity & Resource Scenarios
- Format: 5 pages · 10 problems · Answer key included · PDF
- Best For: Quantitative ecology practice
- Time: 45–60 minutes
What's Inside
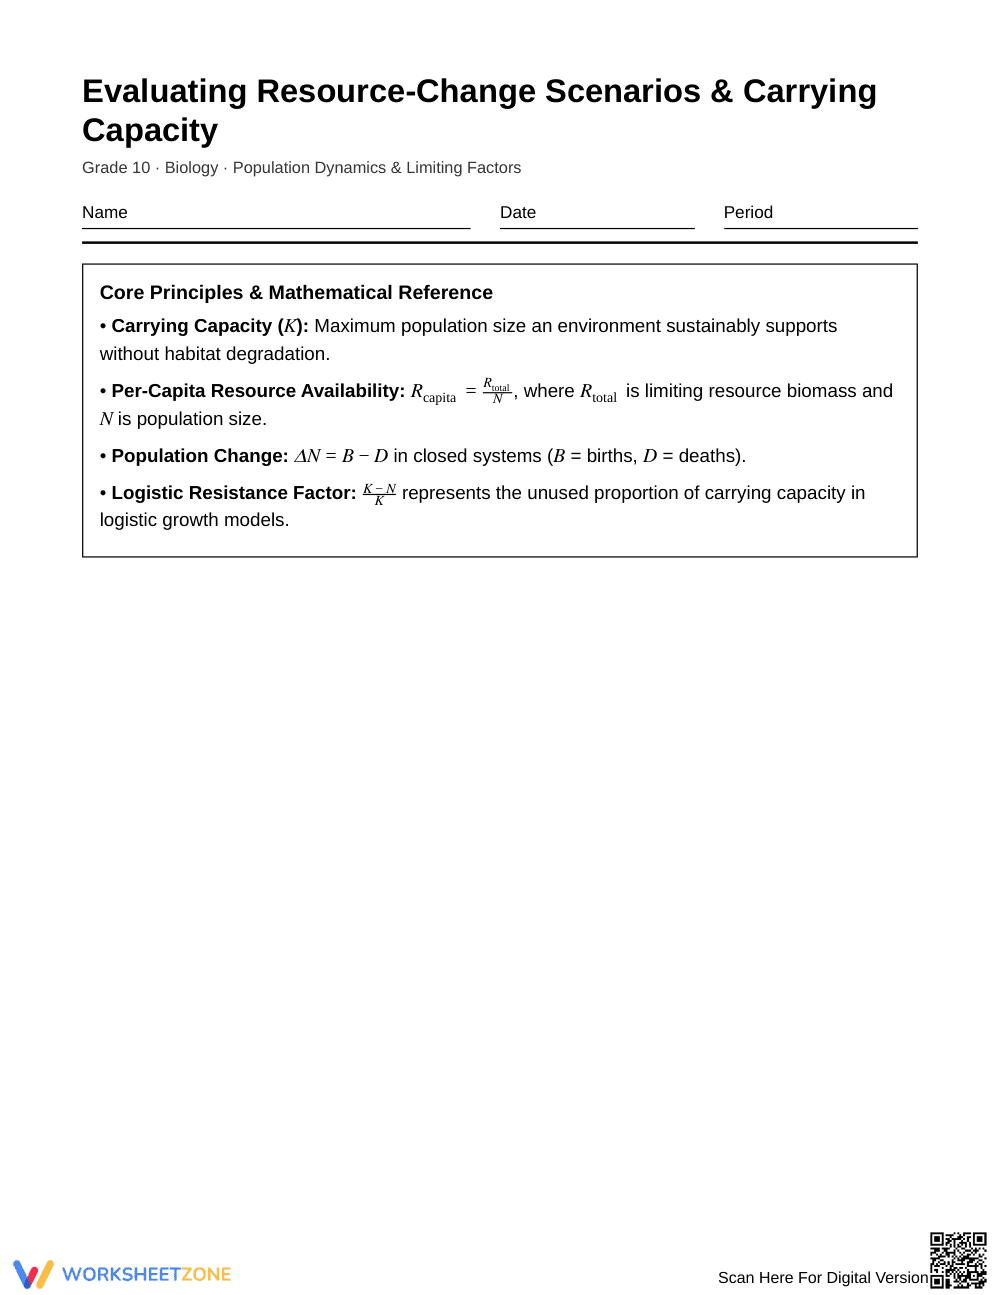
This 5-page worksheet includes core reference equations, two multi-year ecological data tables, and 10 analytical tasks. Students examine environmental variables including dissolved oxygen, temperature, and browse biomass. A 3-page teacher answer key provides complete mathematical calculations, model explanations, and claim evaluations.
Skill Progression
- Guided practice (Tasks 1–2): Students classify limiting factors and identify physical habitat constraints from baseline data.
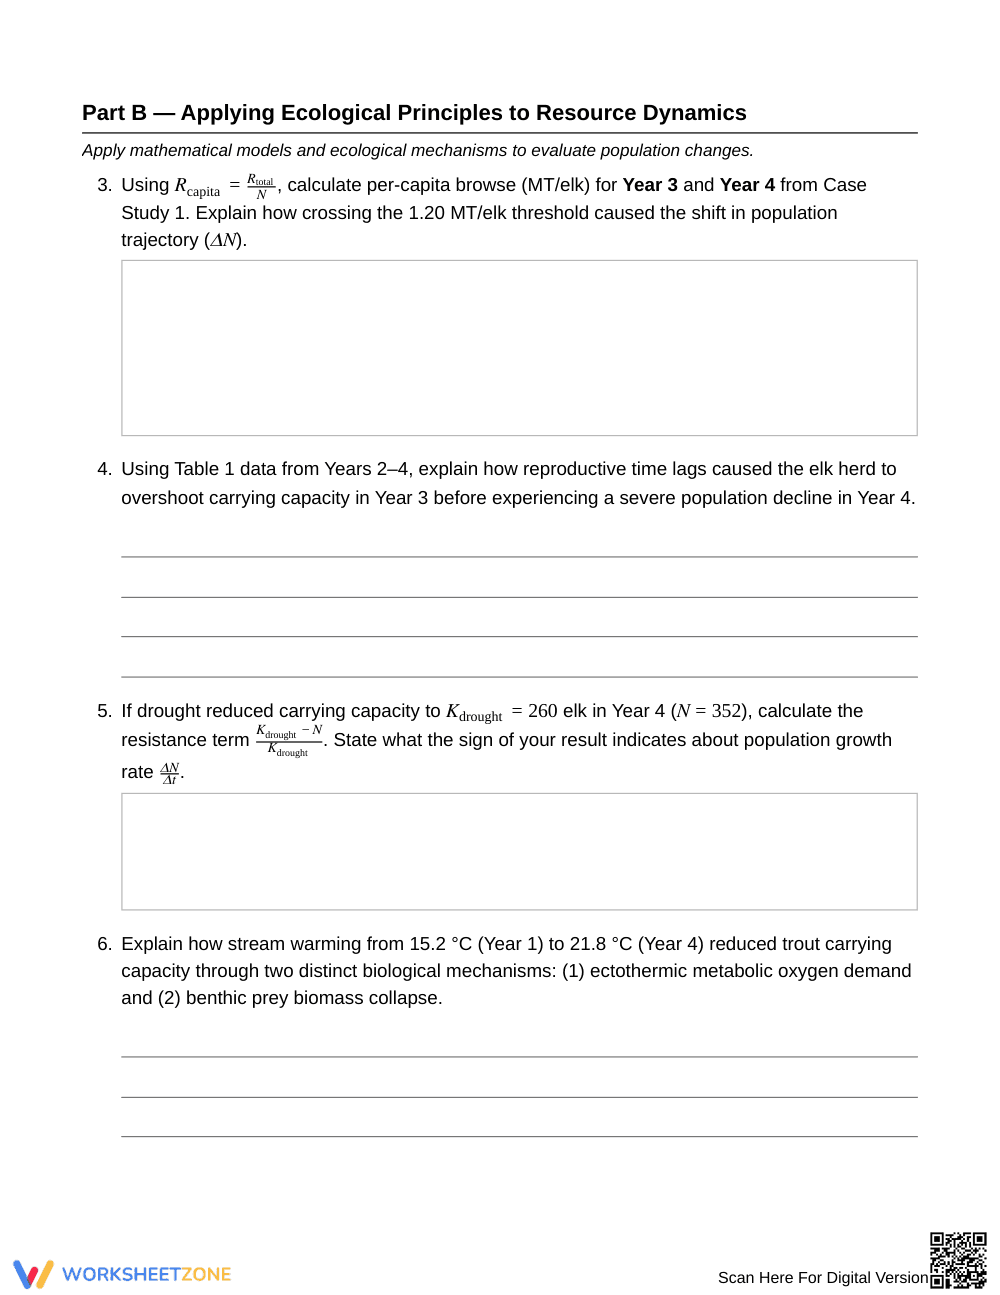
- Supported practice (Tasks 3–8): Learners apply formulas to compute per-capita browse, calculate logistic resistance, and explain ecological lags.
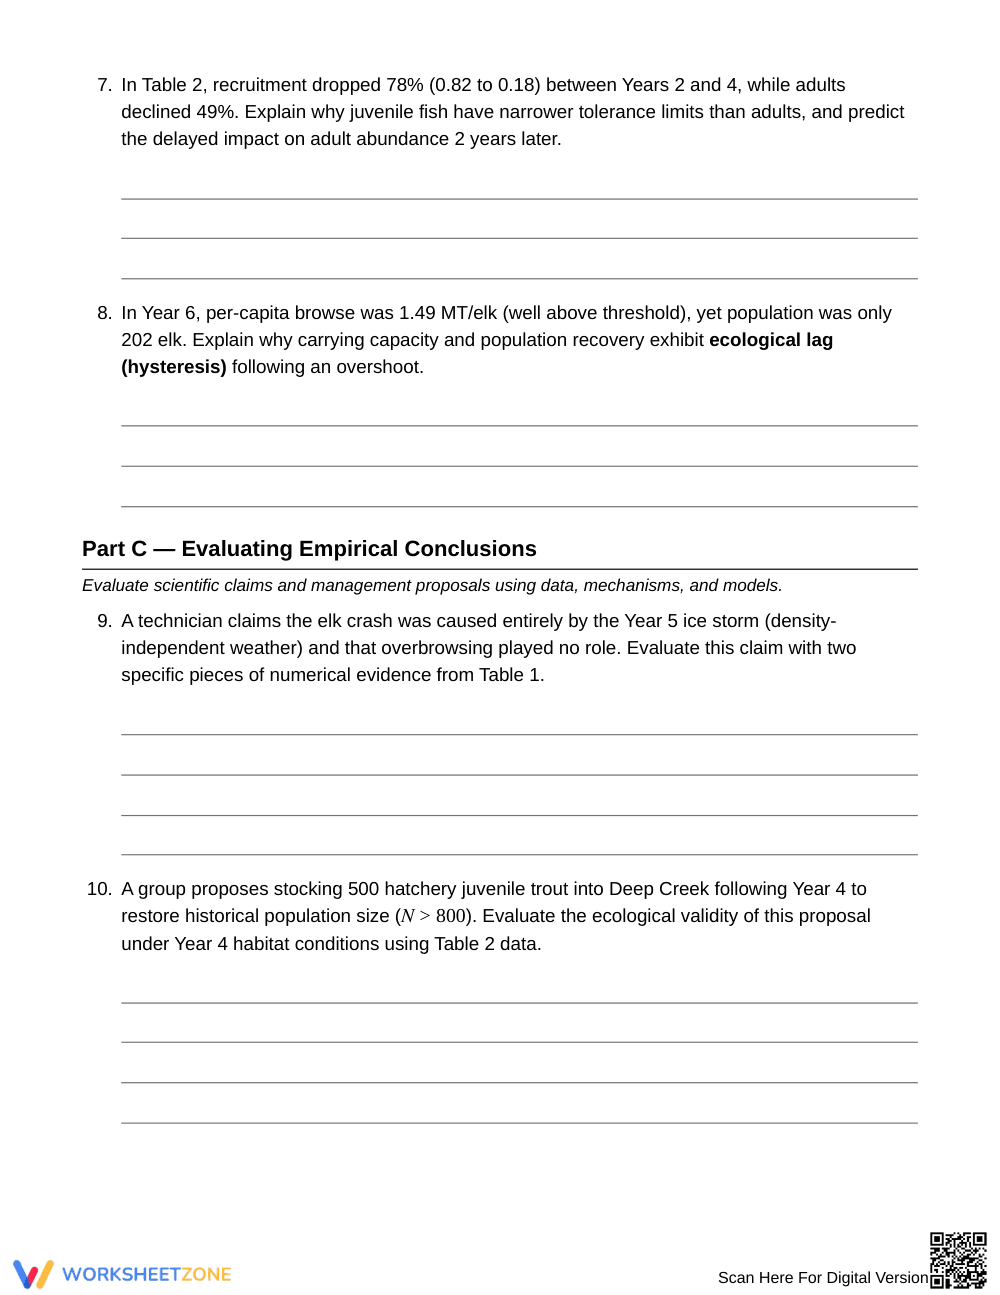
- Independent practice (Tasks 9–10): Students synthesize data to evaluate management claims and test stocking proposal validity.
This gradual-release sequence guides students from basic factor recognition to advanced empirical evaluation.
Standards Alignment
This resource aligns with high school life science standards for population dynamics and ecosystem resilience. Students use mathematical models to evaluate how limiting factors determine carrying capacity. Both standard codes can be copied directly into lesson plans, IEP goals, or district curriculum mapping tools.
How to Use It
Use this worksheet after direct instruction on limiting factors as an in-class analytical workshop. As students work, check if they correctly interpret negative logistic resistance signs as population decline. Alternatively, assign it for small-group collaborative problem-solving. Typical completion takes 45 to 60 minutes.
Who It's For
This resource serves Grade 10 general biology and honors ecology students. Structured formulas scaffold calculations for struggling learners, while claim evaluations challenge advanced students. Pair this activity with an introductory lecture on logistic growth or interactive ecosystem simulations.
Quantitative literacy in secondary science education directly reinforces conceptual mastery of ecosystem dynamics and population regulation. According to research on structured inquiry by Fisher & Frey (2014), guiding students through deliberate progressions from factor identification to quantitative modeling and evaluation significantly enhances scientific reasoning and retention. This 10-task biology worksheet implements that instructional model by pairing multi-year synthetic data sets with explicit mathematical applications, including per-capita resource formulas and carrying capacity resistance terms. As high school students analyze ecological constraints across terrestrial and aquatic ecosystems, they move beyond memorization to critique scientific claims and predict delayed population responses. Providing students with concrete data tables and structured analytical prompts ensures that learners develop the higher-order critical thinking skills necessary for advanced life science coursework.


