Data and graphing pdf worksheets for kindergarten give teachers a printable bridge between the hands-on sorting children do naturally and the representational math they'll need throughout elementary school. This set covers picture graphs, tally marks, bar charts, and object classification — all kept within the developmental range where kindergartners work most productively: small categories, counts of ten or fewer, and visual formats that put the data right in front of them.
Skills Built Across the Set
Each worksheet targets one specific skill so students aren't being asked to sort, count, tally, and graph in the same task before they've mastered any single step. The skills across the full set include:
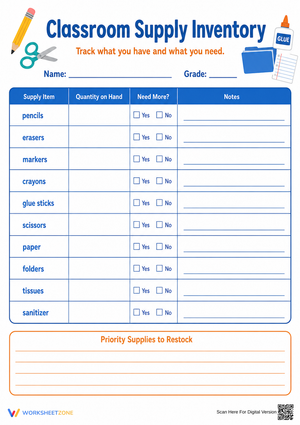
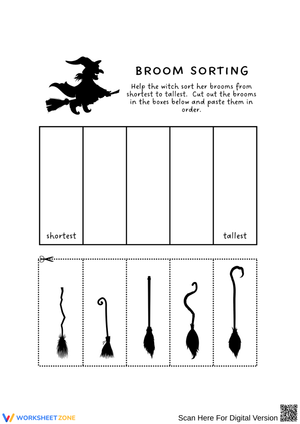
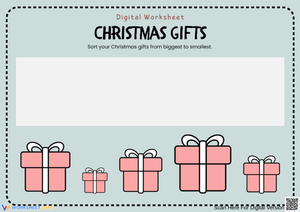
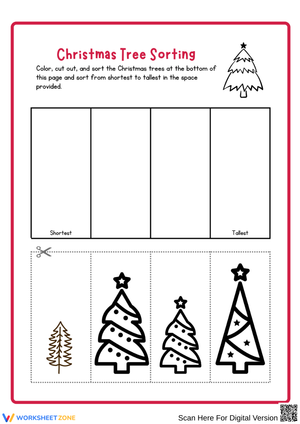
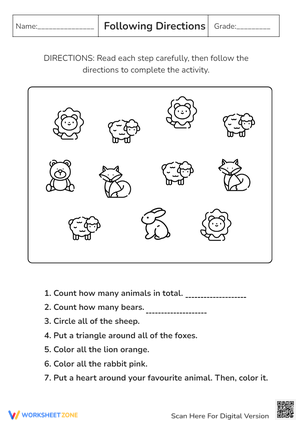
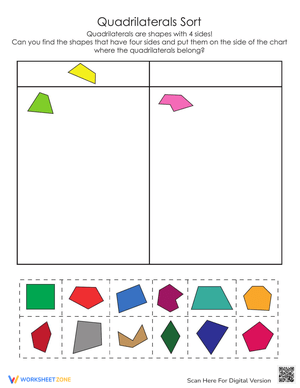
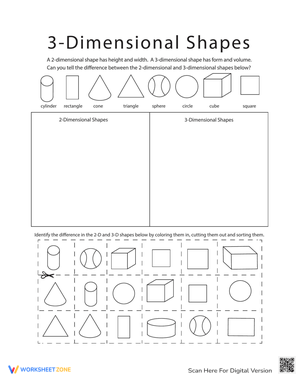
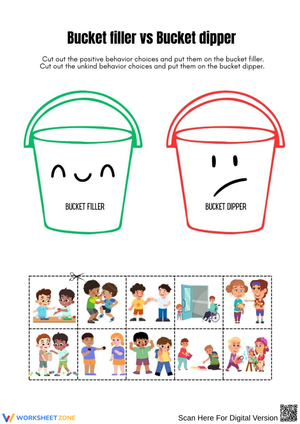
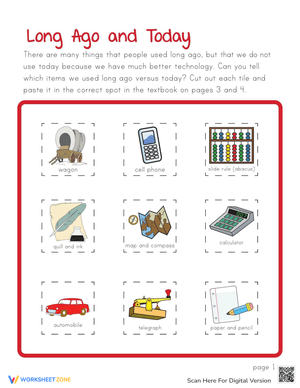
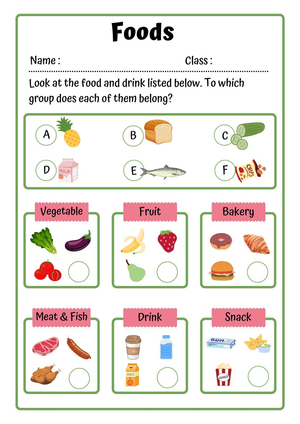
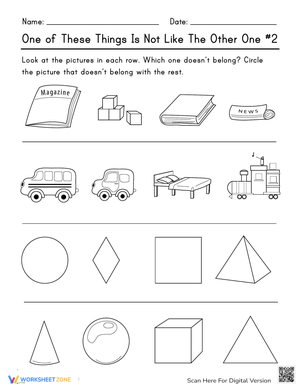
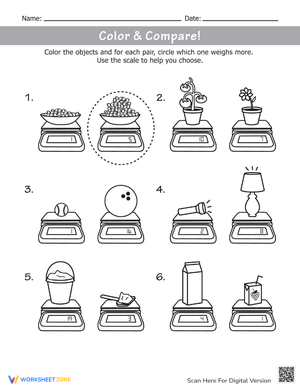
- Object classification by attribute — students sort pictures into two or three categories based on color, shape, size, or type, then count how many belong in each group
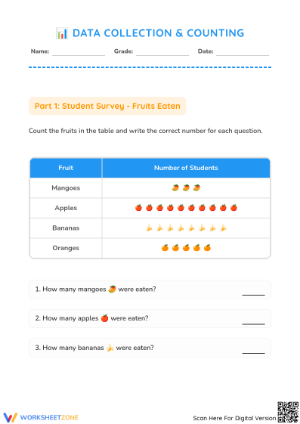
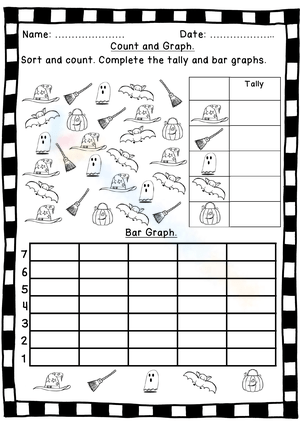
- Tally mark recording — students draw tally marks to represent counted quantities, including the crossed fifth mark that reliably trips up early learners
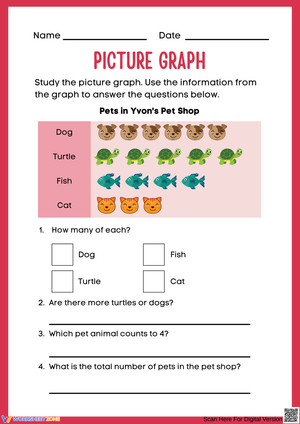
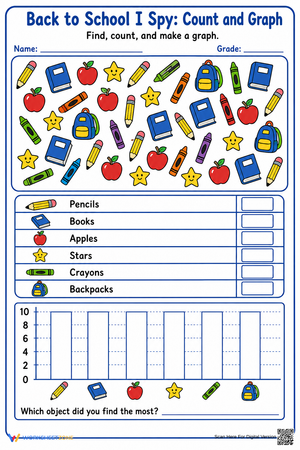
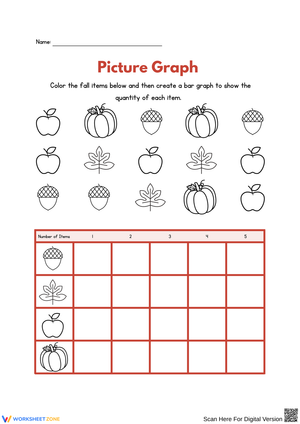
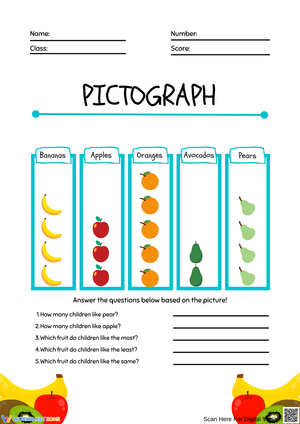
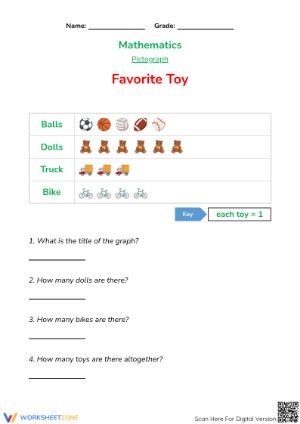
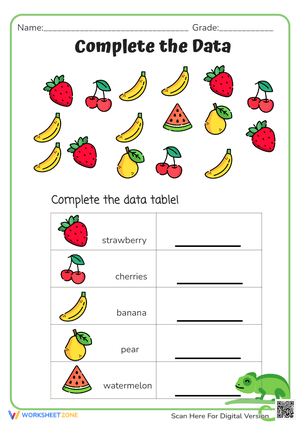
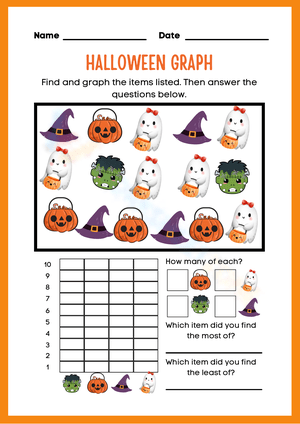
- Picture graph construction — students draw or place one icon per item in a labeled row, building the graph from their own count rather than reading one already made for them
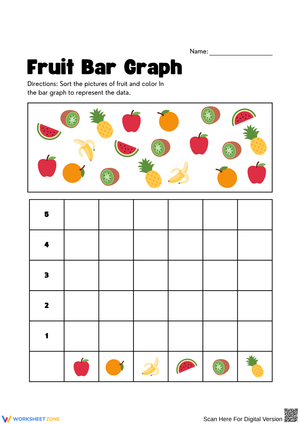
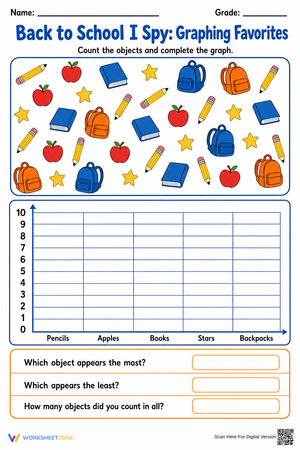
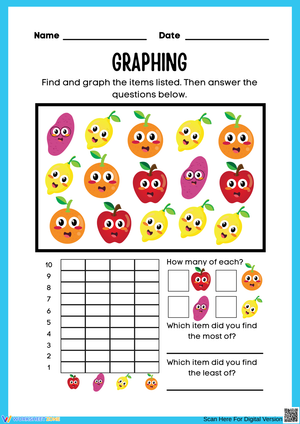
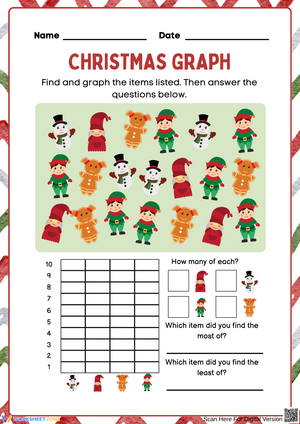
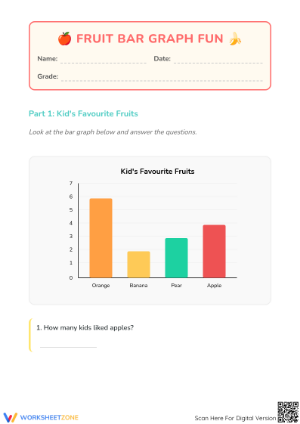
- Bar graph coloring — students fill in one box on a blank grid for every item counted, then answer questions using comparative language: more than, fewer than, equal to
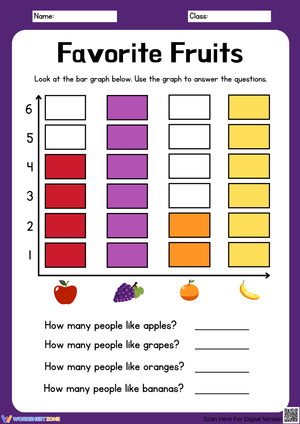
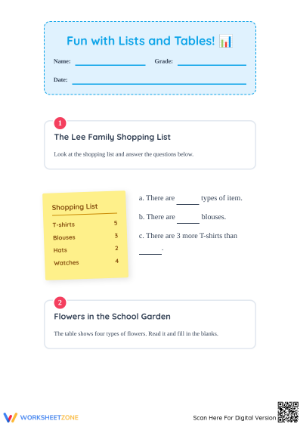
- Reading completed graphs — students answer interpretation questions about graphs they didn't build themselves, separating the reading skill from the construction skill
How the Skills Build on Each Other
Most kindergartners arrive able to sort a pile of blocks by color. What they can't yet do reliably is hold a category in mind while moving from a physical pile to a two-dimensional record of it. That gap between the concrete and the representational is exactly what teachers are managing across this progression, and it's why the sequence matters.
Tally marks come first because they're nearly one-to-one: one mark, one object, right in front of the student. Picture graphs follow because placing a sun icon in the "sunny days" row still carries clear visual logic — the icon looks like the thing it represents. Bar graphs come last. Coloring in a blank box to represent a sunny day is abstract; the box looks nothing like the sun. Teachers who skip straight to bar graph work often see students color two boxes for one object because the visual connection isn't there yet. Running the sequence in order makes those later worksheets productive instead of frustrating.
Lesson-Planning Ideas to Get the Most From These Worksheets
The most reliable entry point is morning meeting. If you're already running a daily weather chart or a class vote — "How did you get to school today?" — you can model the target skill on chart paper before distributing the corresponding worksheet. Students who just watched a tally chart built together are far readier to complete one independently than students who open a worksheet cold with no prior context.
Data and graphing pdf worksheets for kindergarten also work well as math center materials with minimal prep. Laminate the bar graph worksheets and keep them alongside a bin of colored counting bears. Students grab a handful, sort by color, record their tally, then color the laminated graph with a dry-erase marker, wipe it clean, and run the whole thing again with a new handful. The same worksheet becomes five minutes of repeated practice without printing a fresh copy each round.
For a guided group at the back table, the picture graph and tally worksheets pair well with ten minutes of concrete work first. Keep a small tray of mixed objects — two-color erasers work well — and have students sort and count before touching the worksheet. The worksheet then functions as a record of what they already figured out with their hands, which removes the anxiety that stalls some students when a blank graph appears with nothing to count yet. Using transparent counting chips directly on top of the bar graph grid before students color is another useful intermediate step: they physically build the graph on the worksheet, correct any counting errors by moving a chip, and only commit crayon to paper once they're confident.
Common Misconceptions to Watch For and Correct
The most persistent error in early bar graph work is the off-by-one mistake: a student counts five red apples correctly, then colors six boxes because they counted the bottom gridline as the first box. You'll see this pattern repeatedly until students internalize that boxes represent objects, not lines between them. Catching it in the first few bar graph worksheets — before it becomes a habit — saves a lot of remediation later.
With tally marks, the trouble runs in the opposite direction. Students who draw the four vertical lines correctly almost always skip the crossing slash on the fifth mark, leaving a cluster of individual lines that can't be read in groups. The deeper problem is that students see the cross as a drawing convention rather than a grouping signal. Connecting it explicitly to counting by fives — the same thing they do when skip-counting — helps the symbol carry mathematical meaning rather than just looking like a strikethrough.
Picture graph errors tend to surface at the reading stage rather than the building stage. A student who constructed the graph correctly will still answer "which group has more?" by pointing to the row that looks longer — even when that row has fewer icons drawn slightly farther apart. Training students to count the icons before answering, rather than relying on a glance at row length, usually corrects this quickly.
Standard Alignment
These worksheets address CCSS.MATH.CONTENT.K.MD.B.3, which requires students to classify objects into given categories, count the number of objects in each category, and sort the categories by count. The standard specifies that category counts should stay at ten or fewer, which is reflected across the set — no category in any worksheet exceeds that ceiling.
In classroom terms, this standard typically lands in the second or third quarter of kindergarten, after students have stable one-to-one correspondence and reliable counting to ten. Introducing graphing worksheets before counting is solid makes the data work harder than it needs to be. Teachers who wait until students can count a set of eight objects without recounting tend to see noticeably smoother progress through the tally and bar graph activities.
Differentiating These Worksheets Across Ability Levels
For students still building one-to-one correspondence, the tally mark and picture graph worksheets are the right starting point — bar graphs can wait. Giving those students a set of counting chips to place on each pictured object before drawing their tally mark provides a physical anchor that reduces miscounting without requiring any separate materials. The chips are already in most kindergarten math bins.
Students who move through the basic sorting and tally work quickly can extend with a blank template: a pre-labeled graph with empty rows, sent on a short data-collection walk around the classroom or school. How many chairs have cushions? How many don't? Data and graphing pdf worksheets for kindergarten at this level become a starting frame for student-driven inquiry rather than a directed task, which holds the attention of children who disengage from fill-in work once the concept is solid.
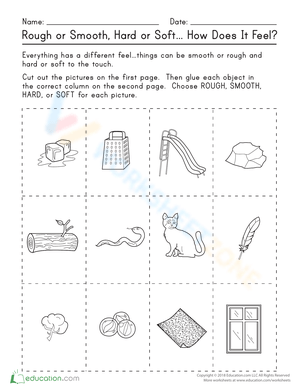
For students in intervention, the cut-and-paste classification worksheets separate the motor demand from the mathematical thinking. Sorting pre-printed pictures into two columns is still genuine data work — it just removes the drawing requirement so teachers can see what the student actually understands about categories and counts, independent of fine motor skill.
Frequently Asked Questions
Should picture graphs or bar graphs come first?
Picture graphs first, without exception. A child who draws a sun to represent a sunny day understands exactly what they're recording. Moving to bar graphs before that visual logic is established asks students to accept an abstraction before they're ready for it. Picture graphs don't just come first because they're easier — they come first because bar graphs make more sense after them.
How do these worksheets fit alongside hands-on manipulatives?
They work best as the paper record of something students already built or sorted physically. The worksheet is where students document what their hands figured out, not where they figure it out for the first time. Teachers who distribute worksheets before any concrete sorting step tend to see lower accuracy, more erasing, and more frustration — not because the worksheets are too hard, but because the cognitive groundwork isn't laid yet.
Are these appropriate to send home?
Data and graphing pdf worksheets for kindergarten involving tally marks and simple picture graphs send home well because the task is clear from the pictures alone and doesn't require a parent to explain much. Bar graph worksheets are riskier as homework early in the unit — a well-meaning parent who explains "just color one box for each apple" can accidentally reinforce the gridline-counting error described above. Keep bar graph practice in the classroom until the concept is solid, then send it home for reinforcement.
What survey topics work best for whole-group graphing lessons?
Topics tied to something happening that day get more genuine engagement than abstract categories. Favorite colors is fine, but "did you eat at home or at school this morning?" or "how many pockets do you have right now?" generates real curiosity about the outcome because students don't already know the answer. When children actually want to see which bar is taller, the graphing feels purposeful rather than procedural.