9th Grade Relative Frequency Worksheets PDF
These 9th grade relative frequency worksheets give teachers ready-to-use practice materials that move students from basic frequency counts through two-way table analysis — the stretch point where most ninth graders slow down. Each worksheet targets a discrete skill in the progression, so you can pull exactly what your class needs rather than assigning an entire sequence at once.
The Specific Skills Targeted
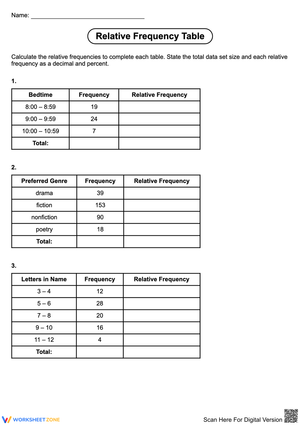
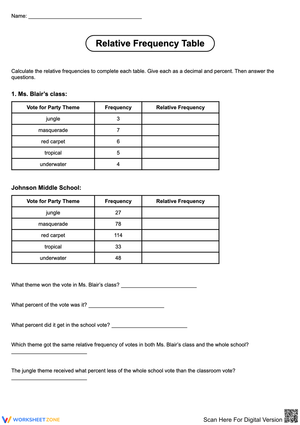
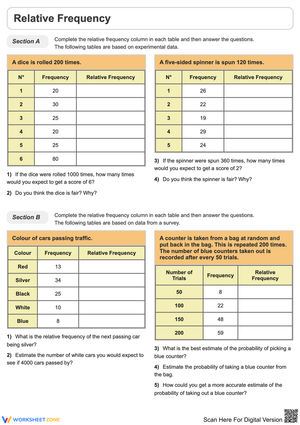
The set addresses four areas of the high school statistics progression. Single-variable frequency tables come first: students tally raw data, compute absolute frequencies, and apply the division formula to convert each count into a proportion. Problems use contexts like school survey results and sports statistics rather than abstract number sets, which matters because ninth graders are more willing to recheck work when the data feels grounded in something real.
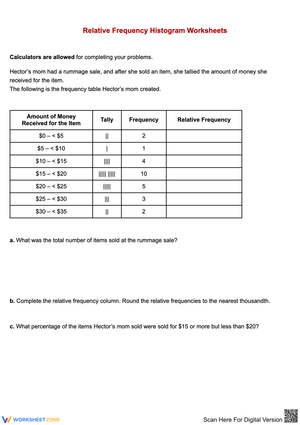
Two-way relative frequency tables are the core of the set and the area where instructional time is best spent. Students work with joint frequencies, marginal frequencies, and conditional relative frequencies across categorical variables — exactly the content CCSS.MATH.CONTENT.HSS.ID.B.5 expects at this level. Relative frequency histograms appear as a third skill strand: students construct and read histograms where the vertical axis shows proportion rather than raw count, which builds the visual reasoning they need to describe distributional shape. A handful of worksheets extend into cumulative relative frequency as an enrichment option for students moving toward AP Statistics.
Standard Alignment
The two-way table worksheets align directly to CCSS.MATH.CONTENT.HSS.ID.B.5, which expects students to summarize categorical data in two-way frequency tables, interpret relative frequencies in the context of the data, and recognize possible associations between variables. In instructional terms, this standard typically lands in the second half of a unit on data and statistics after students have worked with single-variable distributions — which is exactly the sequence the worksheet set follows. The histogram content supports HSS.ID.A.1 (representing data with plots, including histograms) applied to relative frequency rather than raw count.
Building These Worksheets Into Your Lesson Plans
The single-variable worksheet makes a reliable guided-practice anchor for day one of a relative frequency unit. Work through the first problem at the board, narrate the division step aloud, then release students to finish independently or in pairs. Most 45-minute periods have enough room to debrief two or three problems before the bell — don't skip that step, because the errors students make in the first ten minutes are the same ones that reappear on the assessment.
Assign the two-way table worksheet on day two, after a focused direct-instruction segment on joint and marginal frequencies. Before students begin, require them to identify the total being used as the denominator for each column — this 90-second pre-work step eliminates the most common calculation error. The histogram worksheet works well as a station activity or a take-home assignment; pair it with a short exit prompt asking students to write one sentence distinguishing a standard frequency histogram from a relative frequency histogram. That sentence is hard to write without genuine understanding, which makes it a more useful formative check than a numeric answer.
One practical move worth adding regardless of where these worksheets fall in your sequence: require students to express each answer in two forms — decimal rounded to the hundredths place and percentage. Standardized items frequently toggle between representations within the same question, and students who have only ever written 0.35 freeze when the answer choices list 35%. The double-representation requirement takes about thirty seconds per problem and closes that gap before it shows up on a test.
Common Student Errors Worth Watching For and Correcting
The most consequential error in two-way tables is using the wrong denominator for a conditional frequency. A student computing the conditional relative frequency for a specific row will often divide by the table's grand total rather than the row marginal total — and get a number that looks plausible, which is what makes it dangerous. The answer isn't wildly off; it's just wrong in a way that doesn't trigger the student's internal alarm. When you circulate during independent practice, ask students to point to the number they used as their denominator and explain why before they show you the quotient.
A second pattern: students report the raw frequency instead of the relative frequency, particularly when they're moving quickly. This is easy to catch with the sum-to-one check, but only if they've internalized why the check works. If a student can't explain why a distribution's relative frequencies must sum to one, the check becomes a ritual rather than a diagnostic tool.
Rounding is a third friction point. When students round each value independently to two decimal places, the column or row totals occasionally land at 0.99 or 1.01. Teach them to adjust the final entry rather than re-rounding everything — this is how statisticians handle it, and framing it that way gives ninth graders a reason to care about the convention.
Adapting These Worksheets for a Range of Learners
For students who need more support, the partially completed tables on several worksheets remove the setup burden so they can focus entirely on the calculation step. This reduces cognitive load at the point where it most often blocks progress: students who would otherwise spend three minutes figuring out how to organize a table can get directly to the division and proportion work. For students who are moving quickly, the conditional relative frequency problems in the two-way section require them to decide which marginal total serves as the denominator without being told — that decision-making step is where higher-order thinking actually enters the problem. Cumulative relative frequency worksheets serve as a natural extension for students who will take AP Statistics or dual-enrollment courses and need early exposure to distributional thinking.
Frequently Asked Questions
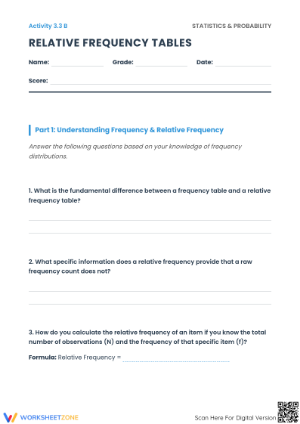
What exactly is relative frequency, and how do ninth graders calculate it?
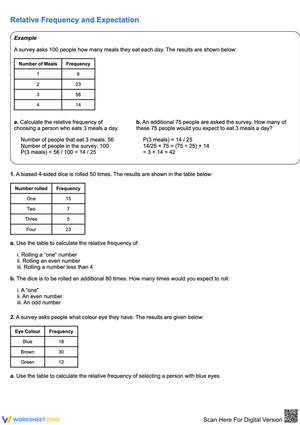
Relative frequency expresses how often a specific outcome occurs as a proportion of all observations. The calculation is straightforward: divide the frequency of the outcome by the total count. The result can be written as a fraction, a decimal, or a percentage — all three forms appear in the worksheets because students need to move fluently between them. In ninth grade, this concept appears in the context of real-world categorical data: survey results, experimental outcomes, and demographic comparisons.
What's the difference between frequency and relative frequency?
Frequency is a raw count — the number of times an outcome occurs. Relative frequency converts that count into a proportion of the whole. If 14 out of 50 students in a survey chose the same lunch option, the frequency is 14 and the relative frequency is 14 ÷ 50 = 0.28, or 28%. Relative frequency is more useful than raw frequency when you're comparing groups of different sizes, which is why it shows up so consistently in high school statistics standards.
How do two-way relative frequency tables differ from single-variable tables?
A single-variable frequency table tracks one categorical variable. A two-way table crosses two categorical variables simultaneously, displaying joint frequencies (proportion of the entire data set), marginal frequencies (proportion within a row or column), and conditional relative frequencies (proportion given membership in a specific category). The interpretive demands are significantly higher, and the denominator changes depending on which type of relative frequency is being computed — which is why two-way tables generate more student errors and require more instructional time.
Are these worksheets appropriate for homework?
The single-variable and histogram worksheets work well as homework because students can complete them independently — the instructions are clear and the skill steps are discrete. The two-way table worksheets are better assigned during class, where a teacher can catch denominator errors before they harden into habits. Sending two-way table work home before students have strong procedural footing tends to produce practiced errors rather than practiced skills.
Clear All