Correlation vs Causation PDF Worksheets for 9th Grade
These correlation vs causation worksheets for 9th grade give students structured practice with one of the most commonly misread ideas in introductory statistics — that a visible pattern between two variables is sufficient proof that one produces the other. Each worksheet moves students through both identification and justification: they aren't just labeling relationships, they're explaining what the evidence does and doesn't support.
What's Inside the Set
The worksheets target the specific reasoning moves that 9th graders need to handle statistical claims with care. Students practice across several task formats so that no single skill gets treated as the whole job.
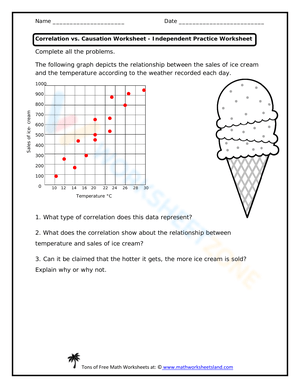
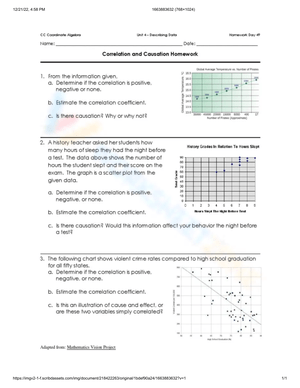
- Scatter plot analysis with prompts for trend direction, strength, and outlier identification — followed by explicit questions about whether the pattern justifies a cause-and-effect claim.
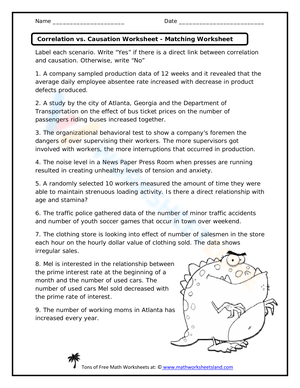
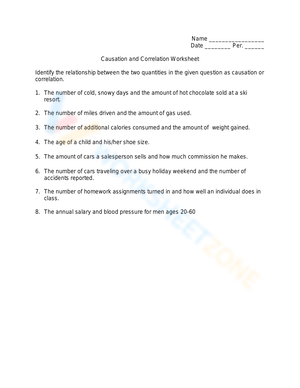
- Real-world scenario sorts where students classify statements as correlation, causation, or neither, then write a sentence defending each placement.
- Lurking variable questions that ask students to name at least one third factor that could account for the relationship shown.
- Claim-rewriting tasks where students correct a flawed headline — for example, changing "More sleep causes higher GPA" to a statement the scatter plot actually supports.
- Short-response items with a two-sentence structure built into the prompt: first state the relationship observed, then state whether causation is warranted and why.
That two-sentence structure is worth noting. Left to their own devices, many 9th graders jump straight to the cause claim without stating what pattern they observed first. The enforced sequence slows that leap down in a way that also makes responses far easier to assess quickly.
Standard Alignment
These worksheets align with CCSS.MATH.CONTENT.HSS.ID.C.9, which requires students to distinguish between correlation and causation. In classroom terms, this standard sits at the end of the statistics and probability strand for high school — it assumes students can already read scatter plots and describe linear associations, and it asks them to apply critical judgment about what those associations prove. That placement means these worksheets work as an extension of scatter plot instruction, not a standalone unit, and they reinforce the interpretive habits students need before moving into formal inference in later courses.
Frequent Student Errors Worth Watching For
The most persistent error isn't a vocabulary failure — it's a reasoning shortcut. Students see a strong positive trend and conclude the relationship must be causal because the pattern looks convincing. A classic classroom example: a scatter plot showing that cities with more hospitals have higher mortality rates. Students who focus only on the direction of the trend will conclude hospitals cause death. The more interesting question — why would a city need more hospitals? — doesn't occur to them without prompting.
Reverse causation creates its own confusion. When students see that students who study more tend to score higher, most correctly assume studying drives scores. But when you flip the example — students who score higher tend to study more — some students call that causation too, reasoning backward. They haven't thought through which direction the mechanism actually runs, or whether both variables might share a common driver like academic motivation.
A third error involves lurking variables. Ice cream sales and drowning incidents both peak in summer. Students who haven't thought about confounding often suggest one influences the other before considering that a third factor — warm weather driving outdoor activity — explains the pattern in both. These worksheets build in explicit prompts for that third-variable search, which keeps students from treating a two-variable display as a complete picture.
Lesson-Planning Ideas to Get the Most From These Worksheets
A three-phase structure works reliably for this topic. Open with a projected example — one where the variables are correlated but clearly not causal (ice cream and sunscreen sales, for instance) — and model the two-sentence reasoning format aloud: state the relationship, then state why causation doesn't follow. That explicit modeling matters more here than on most statistics topics because students need to see what a disciplined claim actually sounds like before they attempt one themselves.
Move next into guided practice with a scatter plot the class annotates together. Ask students to describe the trend before anyone raises the causation question. Sequencing it this way, pattern first and interpretation second, reduces the tendency to skip directly to a causal conclusion. After five to eight minutes of group analysis, release students to partner or independent practice with the worksheets.
A color-coding annotation routine strengthens the independent work phase: students underline phrases that describe observed correlation in one color and circle any missing evidence for causation in another. This works particularly well for multilingual learners who benefit from a visible scaffold before writing full sentences. Close the lesson with a claim-rewriting exit ticket — one flawed statement, corrected in their own words. The responses sort quickly into three groups: students who can identify and explain, students who can identify but not justify, and students who need reteaching on the core distinction.
Adapting These Worksheets for Different Student Levels
For students who need additional support, remove the open-ended lurking variable questions and replace them with a prompted list: "Could this relationship be explained by (a) time of year, (b) age, or (c) a third behavior? Which fits best and why?" That structure preserves the reasoning demand while lowering the barrier to entry.
Students who move quickly through identification tasks benefit from extension prompts that raise the stakes. Ask them to design a study that could establish causation for one of the worksheet scenarios — what would researchers need to control, measure, or hold constant? This pushes toward experimental design thinking, which connects directly to what they'll encounter in biology and later in AP statistics. It also reveals whether they understand that correlation and causation aren't just vocabulary terms but distinct evidentiary standards.
Frequently Asked Questions
Can these worksheets replace direct instruction on scatter plots?
They work best after students already understand how to read and describe a scatter plot — trend direction, strength, and outliers. The worksheets assume that foundation and build the interpretive layer on top of it. Teachers who introduce the scatter plot display and this reasoning skill simultaneously will want to add more modeling time before releasing students to independent practice.
How do I handle students who correctly identify correlation but refuse to commit to an explanation of why causation isn't proven?
This is one of the most common stalls, and it usually signals that students haven't internalized what additional evidence would actually be needed. A useful prompt: "What would a researcher have to do to prove causation here?" Asking them to describe a controlled experiment — even informally — forces them to articulate what's missing from the observational data in front of them.
Are these appropriate for use in a science classroom as well?
Yes, and the science context often makes the distinction feel more urgent. Health claims, environmental data, and biology research all involve correlation-heavy evidence. Teachers in integrated science or biology courses use these correlation vs causation worksheets for 9th grade alongside experimental design units — the two topics reinforce each other when taught in proximity.
What's a realistic timeline for completing one worksheet?
Most 9th graders finish a single worksheet in 15 to 20 minutes when working independently, assuming they've had initial instruction. Partner work typically runs 10 to 15 minutes with productive discussion. Worksheets that include the lurking variable and claim-rewriting tasks will take closer to 20 minutes — factor that in if you're planning a warm-up versus a full practice block.
Clear All