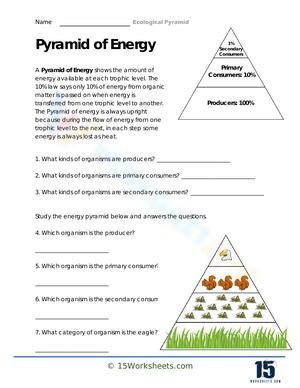
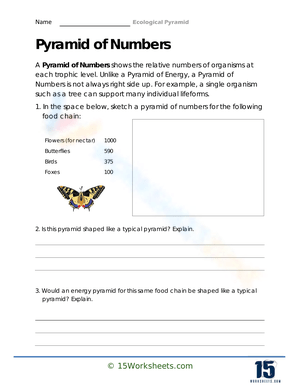
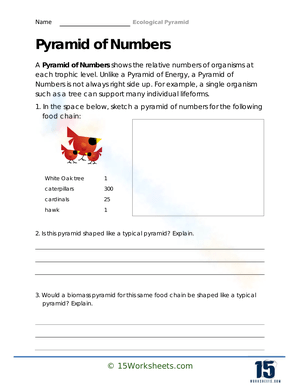
These energy pyramid worksheets for 8th grade give teachers a task that moves students through three distinct levels of thinking in a single work session: classification, calculation, and causal explanation. Each worksheet pairs a tiered visual model with structured prompts, and the result is a formative tool that tells you not just whether a student labeled the levels correctly, but whether they understand why the pyramid narrows at all.
What Students Actually Do on These Worksheets
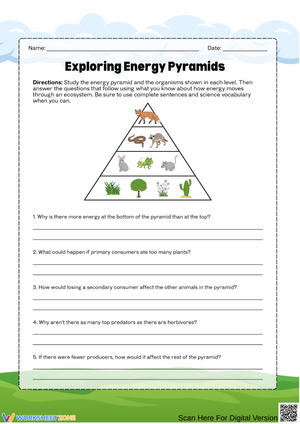
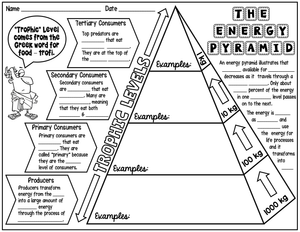
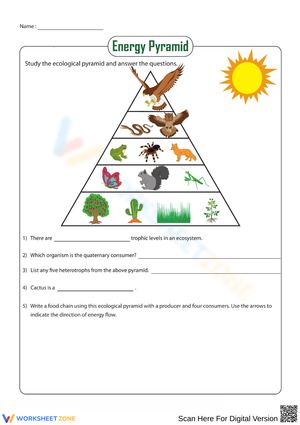
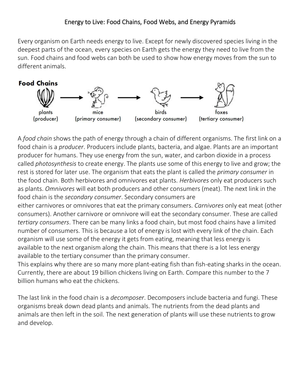
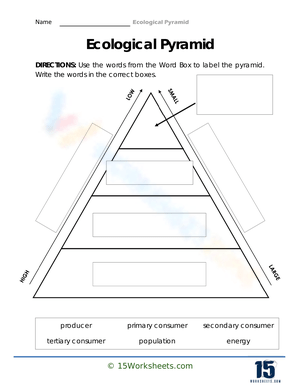
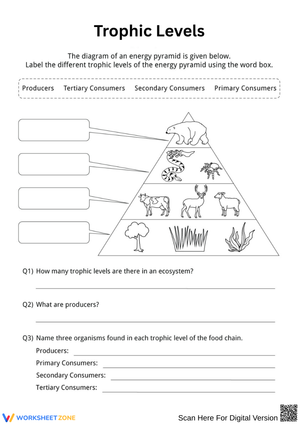
The work is organized so that identification comes first and reasoning comes last. Students begin by sorting organisms — producers, primary consumers, secondary consumers, tertiary consumers — and placing them at the correct trophic level. That step draws on prior knowledge from food chain and food web instruction without introducing new complexity yet.
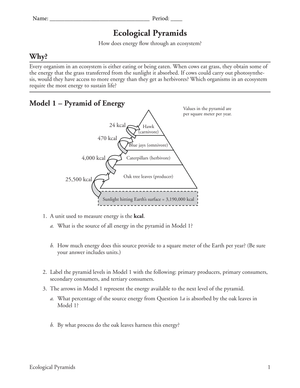
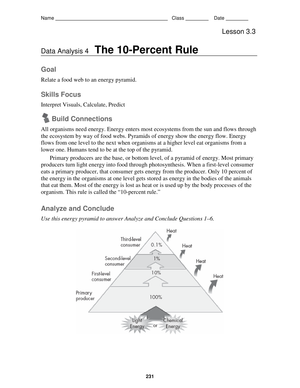
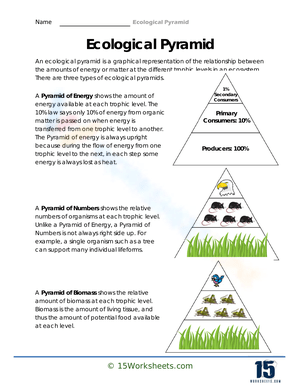
From there, each worksheet shifts to quantitative work. Students apply the 10% rule to estimate available energy as it moves upward, starting from a given producer base. Finally, they write a short explanation: where does the energy go, and why does so little remain at the top? That third step is where the real gap shows. Students who can label the pyramid and complete the arithmetic still often write something like "there is less energy because there are fewer animals," which reverses the cause-and-effect relationship entirely.
- Label producers and all three consumer levels using organism names drawn from a provided food chain.
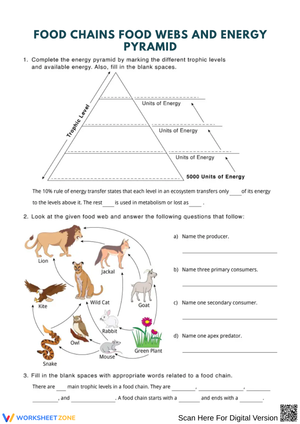
- Apply a starting energy value at the producer level and calculate available energy at each higher level using the 10% rule.
- Match organisms from a food web to the appropriate trophic level on a blank pyramid diagram.
- Write one sentence comparing what an energy pyramid shows versus what a food web shows.
- Predict what happens to higher trophic levels when producer populations decline.
Frequent Errors Worth Anticipating Before the Lesson
The most common calculation mistake at this grade is subtracting 10 instead of taking 10 percent. Give students a producer base of 10,000 energy units and a meaningful share will write 9,990 for the primary consumer level. The error signals that students hear "10% rule" as "lose 10 units" rather than as a proportional relationship. A brief worked example at the top of each worksheet — one that shows the correct method alongside the wrong one — stops this before it spreads during partner work.
A second mistake is harder to catch in a labeled diagram but surfaces immediately in written responses: students believe top predators are rare because they are powerful or dominant, not because there is simply less available energy to sustain them. This is the carrying capacity connection that most textbook treatments underemphasize. When a worksheet prompt asks students to explain — using specific energy units — why a hawk population is limited in a given ecosystem, that response tells you whether students are applying the model or just recalling a term. The prompts in the set are built to surface exactly that distinction.
A third pattern shows up when students treat the pyramid as a picture of population size rather than available energy. A student might draw the tertiary consumer level narrower because "there are fewer hawks," not because "less usable energy reaches that level." Those responses look nearly identical on a labeled diagram, but they reflect entirely different understandings. Written explanation prompts are the only way to tell them apart.
Building These Worksheets Into Your Lesson Plans Effectively
The most reliable approach treats each worksheet in three passes rather than one sweep. First, students work through identification and labeling independently. Second, they do the 10% calculations and compare answers with a partner before you debrief as a class. Third, they write the explanation. Splitting the work into those stages reduces cognitive overload noticeably — students who freeze when everything appears at once often complete each stage without trouble when the steps are separated in time.
Bell ringers work particularly well here. A prompt asking students to label the base of a pyramid and explain why producers belong there takes about six minutes, generates a discussion anchor, and surfaces misconceptions before direct instruction starts. Teachers who reach for energy pyramid worksheets for 8th grade as exit tickets tend to collect only the written explanation at the end — the causal sentence — which gives fast formative data without grading an entire set of labeled diagrams. That one-sentence response tells you whether to reteach, move on, or pull a small group.
Later in the unit, the same worksheet works well as spiral review before a summative assessment. Assign it without re-teaching, note which sections students complete fluently versus where they pause, and use that as your reteach targeting list. The 10% calculation and the explanatory writing are almost always the two components that need the most reinforcement at that stage.
Standard Alignment
These resources connect directly to NGSS MS-LS2-3, which asks students to develop a model to describe cycling of matter and flow of energy among living and nonliving parts of an ecosystem. Energy pyramids are one of the named model types for this standard, and the written explanation prompts align with the science and engineering practice of constructing explanations from evidence. Teachers working inside NGSS-aligned units can use these worksheets as the practice component immediately after a lesson on trophic relationships and then return to them as a formative check before students begin their full ecosystem modeling tasks. The skills targeted — interpretation of a quantitative model, application of the 10% rule, and written causal reasoning — map directly to the evidence statements for this standard at the middle school level.
Differentiating Across Ability Levels in a Mixed-Readiness Class
For students who struggle with the abstract model, keeping the organism set familiar makes a significant difference. Grass, rabbit, snake, and hawk give students a recognizable food chain so they can focus on understanding the energy pattern rather than sorting out who eats whom in an unfamiliar ecosystem. Once a student grasps the structure with that straightforward example, moving to a marine or freshwater context adds appropriate complexity without requiring another explanation of the underlying concept.
Students who are ready for more can engage with prompts that introduce carrying capacity language explicitly: given only 10 energy units reaching the tertiary consumer level, how many hawk-sized predators could a given area of habitat realistically support? That kind of question asks students to use the pyramid as a predictive model, not just a labeled diagram. Energy pyramid worksheets for 8th grade that include open-ended application prompts like this push well beyond recall into genuine ecological reasoning. On the other end of the readiness range, providing organism sorting cards — cut-outs students physically arrange before they write — gives concrete support without altering the conceptual target or changing the assessment criteria.
One limitation worth naming honestly: students who have not yet built fluency with percentages will hit a wall at the 10% calculation step. If your class is mid-unit on percent operations in math, this is a natural cross-curricular connection worth naming explicitly. If they haven't reached that yet, plan to work through the arithmetic together as a class and preserve student independence for the labeling and explanation sections.
Frequently Asked Questions
Do students need to have studied food webs before attempting these worksheets?
Food chain knowledge is the minimum prerequisite. Students who understand that organisms eat one another in a sequence can place themselves on the pyramid and apply the 10% rule. That said, students who have already worked with food webs come in with a real advantage on the comparison questions and causal writing tasks, because they can already name multiple feeding relationships at a given trophic level rather than a single linear path.
How much class time does each worksheet require?
A full worksheet — labeling, calculation, and written explanation — runs 20 to 25 minutes for most 8th graders working independently. The labeling section alone takes 6 to 8 minutes, which makes it a usable bell ringer if you assign only that portion. Pulling the explanation prompt as an exit ticket adds roughly 4 to 5 minutes at the close of a period. The three-pass approach described above means you can spread the same worksheet across two instructional blocks if that serves your pacing better.
What's the difference between an energy pyramid and a food web, and do these worksheets address both?
A food web maps the feeding relationships among organisms in an ecosystem. An energy pyramid shows how much available energy exists at each trophic level and why that amount drops sharply as you move upward. The two models answer different questions. Each worksheet includes at least one prompt asking students to articulate that distinction in their own words, because conflating the two is one of the most persistent misconceptions in ecosystem units.
Do these worksheets connect to standardized test question formats?
Energy transfer through trophic levels appears on many state science assessments and on NGSS-aligned performance tasks. Assessment items at this level typically ask students to interpret an unfamiliar pyramid diagram, apply the 10% rule to a new ecosystem, or explain what would happen to higher trophic levels if the producer base declined. Using energy pyramid worksheets for 8th grade that include those exact prompt structures prepares students for the reasoning the test actually demands, not just the vocabulary they might memorize from a textbook glossary.












 Interactive Worksheet Maker
 Quiz Maker
 Word Search Maker
 Crossword Puzzle Maker
 Word Scramble Generator
 Sentence Scramble Generator
 Handwriting Worksheet Generator
 Name Tracing Generator
 Fill In The Blank Generator