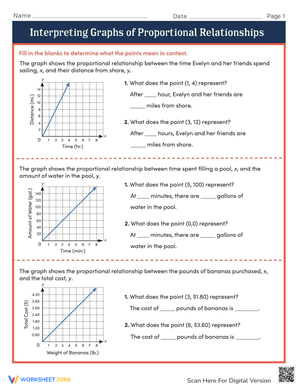
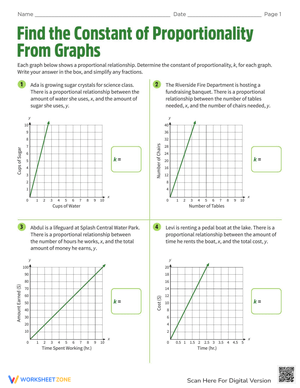
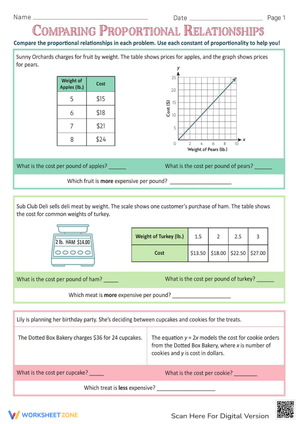
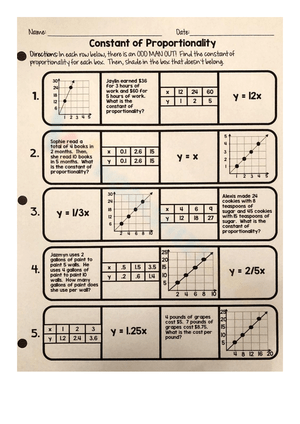
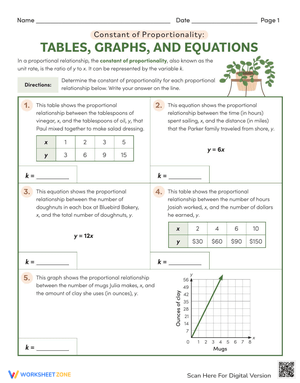
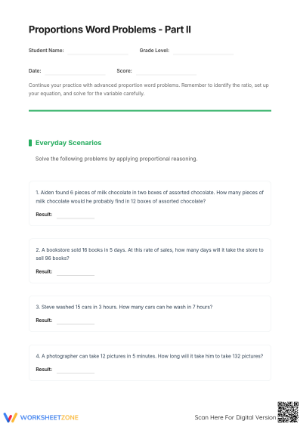
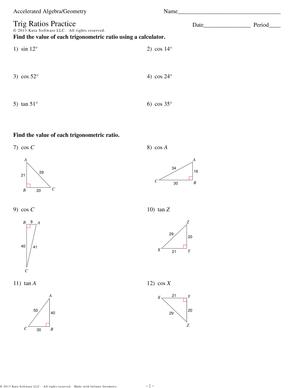
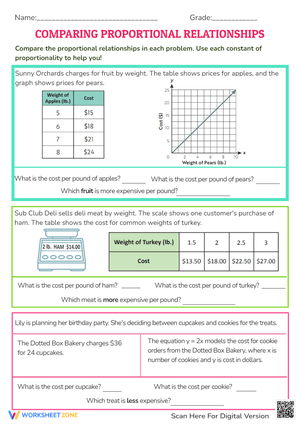
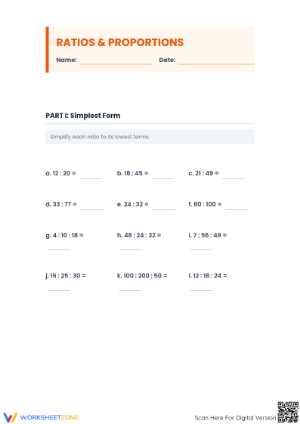
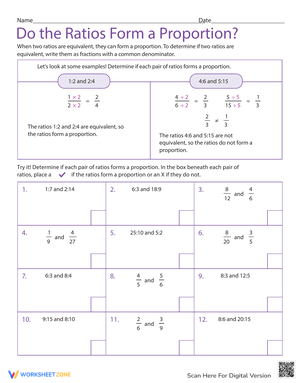
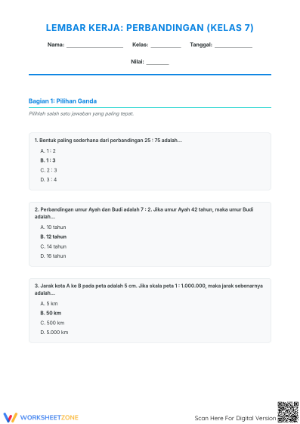
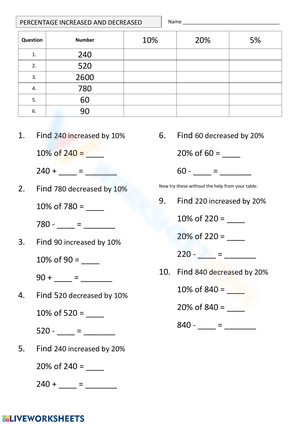
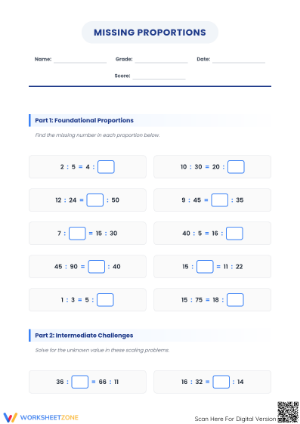
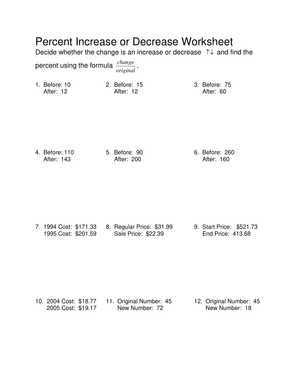
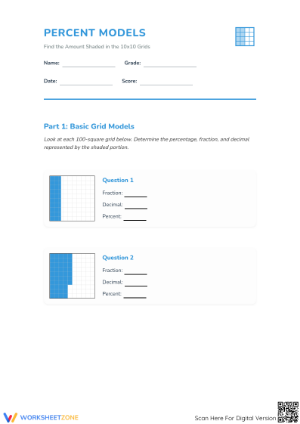
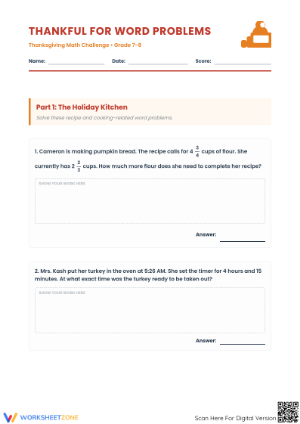
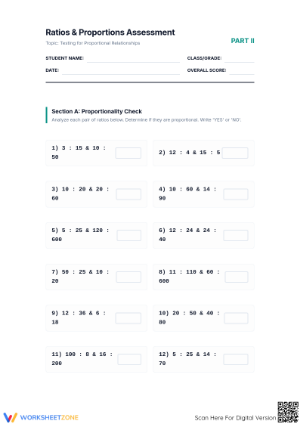
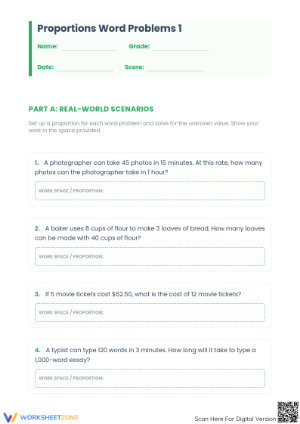
These 8th grade ratios proportions pdf worksheets give teachers standalone practice resources that move well past simple ratio drills — each worksheet targets a specific piece of the proportional reasoning Grade 8 students need, from identifying constants of proportionality across tables and graphs to comparing two relationships shown in different forms. The set includes both focused skill practice and multi-step word problems, making it useful for whole-class review, reteach groups, and the weeks before a linear relationships unit.
The Specific Skills Targeted
Grade 8 ratio and proportion work looks different from what students encountered in sixth grade. Here, the emphasis is on identifying structure — does this relationship have a constant rate? Can it be written as y = kx? What does the graph reveal that the table doesn't? Students need repeated exposure to those questions across multiple representations before they can transfer the reasoning reliably on assessments.
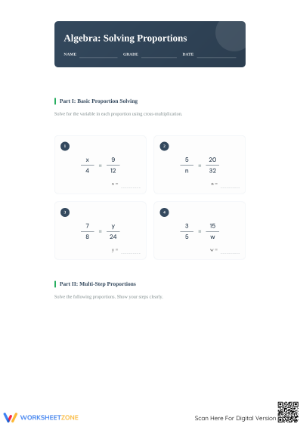
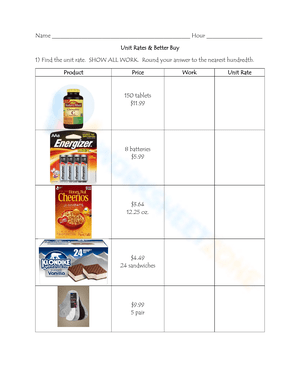
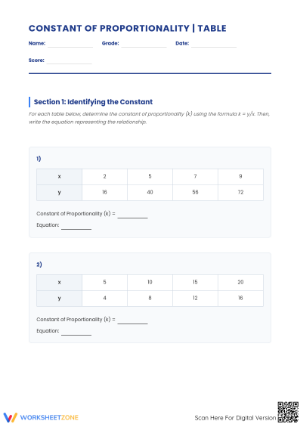
- Finding unit rates and constants of proportionality from tables, graphs, equations, and verbal descriptions
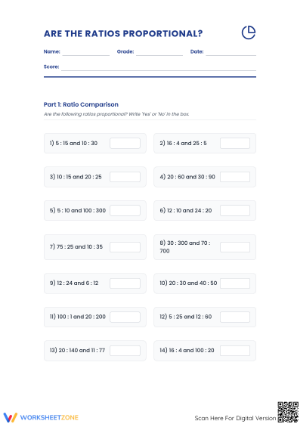
- Determining whether a relationship is proportional or nonproportional and justifying that decision using evidence from the representation
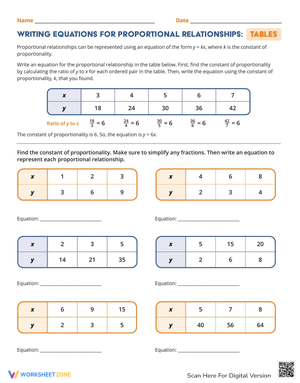
- Writing equations in the form y = kx and interpreting what k means in the problem's context
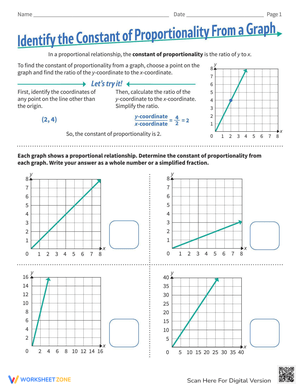
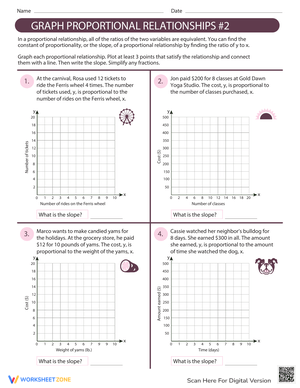
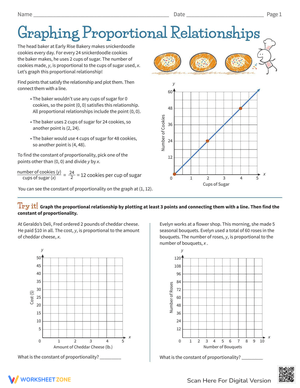
- Reading coordinate graphs to locate the constant of proportionality as a specific point — the point (1, r) — rather than only computing it numerically from a table
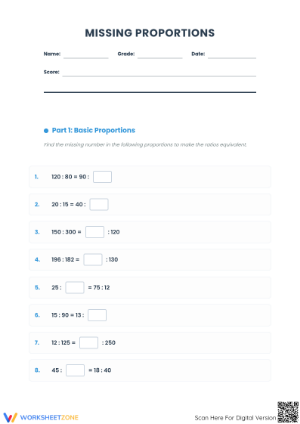
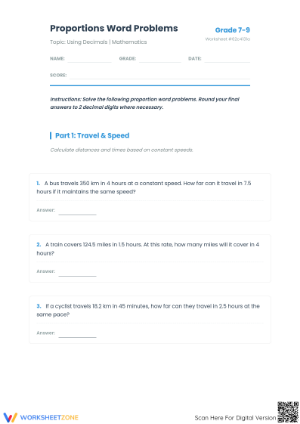
- Solving multi-step word problems involving price, distance, speed, and scale
- Comparing two proportional relationships presented in different forms and identifying which has the greater unit rate
That comparison skill is what separates this set from basic ratio review. A student who fills in ratio tables correctly but cannot determine which of two situations has a faster unit rate — when one is shown as a graph and the other as an equation — is not ready for the slope comparisons that appear later in the year. Well-chosen 8th grade ratios proportions pdf worksheets give teachers a way to surface that gap before it becomes a problem in the linear equations unit.
Mistakes Students Make That These Worksheets Help You Catch
The most persistent error in Grade 8 proportional reasoning is visual. Students see a graph where the plotted points are evenly spaced — a clean, regular pattern — and conclude the relationship is proportional without checking whether the line passes through the origin. They are pattern-matching on "looks straight" rather than reading the structure. A worksheet that includes nonproportional linear relationships, where the y-intercept is not zero, forces that shortcut into the open. Students have to defend their reasoning rather than just circle an answer.
A second error shows up when students write an equation from a table. They will sometimes write y = 3x because they see 3 in one of the output columns, rather than computing the ratio y divided by x from an actual row. The equation looks plausible and often passes a quick visual check, so the mistake goes undetected in class discussion. These worksheets create enough structured exposure to that task that teachers can catch the substitution error before it migrates into slope work.
Smart Ways to Work These Worksheets Into Your Week
The most natural use is as a targeted practice cycle tied directly to where you are in the unit. Assign a table-and-unit-rate worksheet as a bell ringer at the start of a proportional relationships lesson. Use a comparison worksheet the day before you introduce slope — not as review for review's sake, but as a deliberate conceptual warmup. Students who have just compared unit rates across representations find the shift to slope as a rate of change much less abrupt than students who encounter it cold.
For reteach groups, pull the table-based worksheets first and hold off on graph and equation tasks until students can name the constant of proportionality with confidence. That sequencing is simple but it matters — students who encounter coordinate graphs before they can work fluently with tables tend to get lost in the visual rather than the math. Sub plans are another practical use case. A printed PDF set gives a substitute teacher self-explanatory, standards-aligned math work without supplemental instructions.
- Bell ringers at the start of a proportional relationships lesson, using 4–6 problems from a single worksheet
- Exit tickets after teaching the constant of proportionality — one focused worksheet at the end of class
- Homework the evening after class practice on graphs or equations, reinforcing what students saw in the lesson
- Small-group reteach when students are conflating proportional relationships with nonproportional linear ones
- Sub-day independent work, stored as a PDF ready to print on short notice
Standard Alignment
These worksheets align most directly to CCSS.MATH.CONTENT.8.EE.B.5, which asks students to graph proportional relationships, interpret the unit rate as the slope of the graph, and compare two proportional relationships represented in different ways. They also connect to 8.EE.B.6, where slope is explained using similar triangles and the equation y = mx + b is derived — a conversation that only holds together when students already understand what proportional graphs look like and why they behave the way they do.
In classroom terms, this practice belongs in the two to three weeks before or during the introduction to slope. The standards place proportional relationship comparison tasks here not as enrichment but as a core expectation, which means worksheets asking students to compare unit rates from a table and a graph are not optional add-ons — they reflect what state assessments will actually test.
Adjusting the Worksheets for a Range of Learners
For students who need more support, context-rich tables work better as a starting point than open graphs or bare equations. Familiar scenarios — price per item, miles per hour — let students reason from meaning before they have to read structure. For those students, 8th grade ratios proportions pdf worksheets work best when you assign each worksheet deliberately: table tasks first, then graph-based work, then equation-focused problems. No separate leveled materials are required; a deliberate order of assignment does most of the work.
For students who are ready to push further, the comparison tasks carry the most demand. Ask them to generate a second representation on their own — draw the graph from a given table, or write the equation from a graph — and then explain in writing whether the relationship is proportional and how they know. That addition turns an existing task into a higher-order problem without requiring a different worksheet altogether.
Frequently Asked Questions
Are these worksheets for initial instruction or for practice after a lesson?
Primarily for practice. These resources work best after students have had some direct instruction on proportional relationships. Assigning a worksheet before students have encountered the concept in class leads to frustration, not learning — the tasks assume some familiarity with tables, graphs, and the idea of a constant rate.
How do these worksheets address the difference between proportional and nonproportional relationships?
That distinction is woven directly into the set rather than treated as a sidebar. Students encounter both relationship types across multiple representations and are asked to classify and justify — not just identify. That focus is deliberate because the proportional/nonproportional boundary is where Grade 8 students most often lose ground, and repeated practice with it builds the discrimination skills they need before slope comparisons begin.
Can these resources support test prep?
Yes. Grade 8 state assessments consistently include multi-step proportion problems, unit rate interpretation, and comparison tasks across representations. The 8th grade ratios proportions pdf worksheets that include mixed-format problems — asking students to move between a table, a graph, and a word problem in a single task — are especially useful for test prep because they require students to choose a strategy rather than apply one practiced procedure.
What about students working below grade level?
Sequence the set carefully for those students. Start with table-based worksheets in familiar contexts, then add graph work only after they can reliably compute the constant of proportionality from a table. Writing the equation y = kx at the top of each worksheet as a reference before students begin can remove a memory-load barrier without changing the mathematical demand of the task itself.













 Interactive Worksheet Maker
 Quiz Maker
 Word Search Maker
 Crossword Puzzle Maker
 Word Scramble Generator
 Sentence Scramble Generator
 Handwriting Worksheet Generator
 Name Tracing Generator
 Fill In The Blank Generator