


0
Views
0
Downloads
0.0
0
Save
0 Likes
Understanding Two-Way Tables in Data Analysis
0 Views
0 Downloads
Paste this activity's link or code into your existing LMS (Google Classroom, Canvas, Teams, Schoology, Moodle, etc.).
Students can open and work on the activity right away, with no student login required.
You'll still be able to track student progress and results from your teacher account.
Information
Description
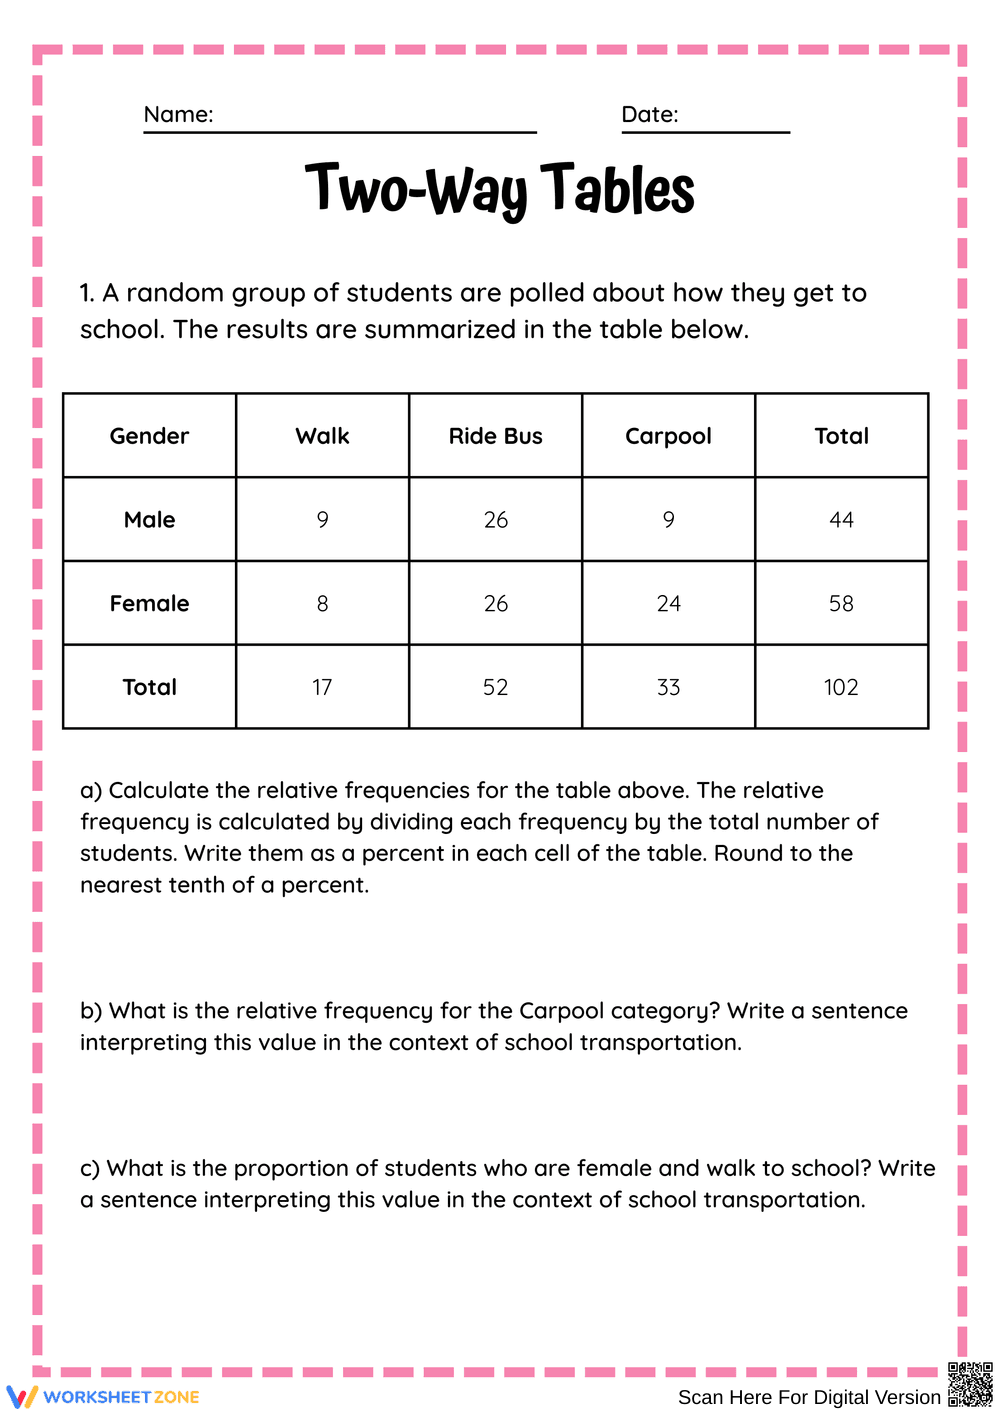
What It Is:
This worksheet introduces students to two-way tables through a practical poll about how students get to school. Students will analyze data regarding gender and transportation methods, enhancing their data interpretation skills.
Why Use It:
This activity helps students learn how to organize and interpret data, fostering mathematical reasoning and critical thinking.
How to Use It:
• Display the two-way table
• Guide students to calculate relative frequencies
• Encourage discussions on data interpretation
Grade Suitability:
Best for Grade 6-8.
• Younger kids focus area: Basic data handling
• Older students focus area: Advanced statistics
Target Users:
This worksheet is for teachers and students looking to enhance their math skills in data analysis.