8th Grade Scatter Plots and Lines of Best Fit Worksheets PDF
These 8th grade scatter plots and lines of best fit worksheets pdf give teachers structured, print-ready practice for one of the conceptually heaviest shifts in the grade 8 statistics unit — the move from reading a single graph to analyzing relationships between two numerical variables. Students who can graph a linear equation from a table often struggle here, because real-world bivariate data doesn't follow a clean rule. The pattern only emerges across dozens of scattered points, and the "best" trend line is a judgment call, not a calculation.
What Each Worksheet Asks Students to Do
The skills in this set follow the natural order of how scatter plot analysis develops in the classroom. Students don't arrive ready to interpret slope in context — they need to build from plotting to pattern recognition to prediction, one layer at a time. Finding a reliable set of 8th grade scatter plots and lines of best fit worksheets pdf means looking for resources that treat those stages as connected, not isolated.
- Plot ordered pairs from a two-column data table onto a scaled coordinate plane
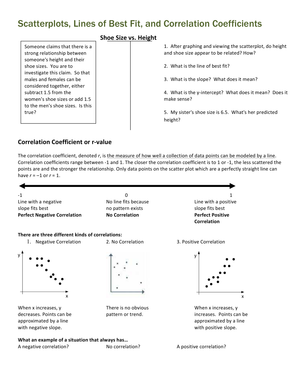
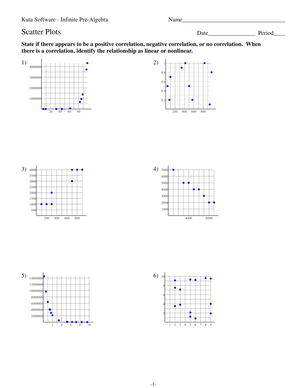
- Describe the association as positive, negative, or none — and explain what that means for the real-world situation
- Determine whether the relationship appears roughly linear or follows a different pattern
- Identify clusters where data points are dense, and outliers that fall well outside the trend
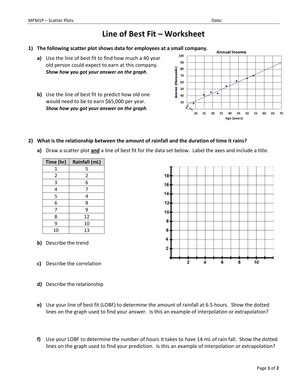
- Draw a reasonable line of best fit by hand, aiming for a balance of points above and below the line
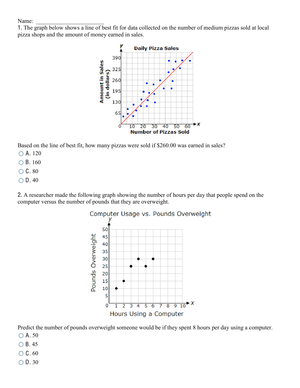
- Use the trend line to estimate an output for a given input value
- Explain what slope and intercept suggest about the real-world context, informally
That last item is where the deeper work happens. A student who draws an accurate line but can only describe it as "going up" has done the graphing without doing the thinking. Each worksheet pushes past graphing by asking students to explain their scatter plots in writing, which surfaces exactly where the understanding breaks down.
Mistakes Students Make That These Worksheets Surface Quickly
Scatter plots come with a specific, repeatable set of student errors. Anticipating them before students begin independent work makes the practice session more productive than correcting after the fact.
The most consistent one: students connect the data points with line segments, treating the scatter plot like a line graph. This happens because line graphs come earlier and feel more familiar. The fix is simple — show both formats side by side during direct instruction and name the difference explicitly. A scatter plot shows paired measurements. A line graph shows a sequence across time. Saying that clearly once tends to stick.
A close second is forcing the trend line through as many data points as possible. Students rotate their rulers trying to hit the most dots, which usually produces a line that is too steep on one end. The correction that works in practice: have students do a "balance check" after drawing — count roughly how many points fall above the line versus below it, and adjust until those numbers are close. It slows students down for about ninety seconds, and the hand-drawn lines improve noticeably.
Extrapolation errors are equally common. If a scatter plot shows paired data for hours of practice (2 through 8) and made free throws, a student will confidently extend the trend line and predict 50 made baskets for 30 hours of practice without questioning whether that range appears anywhere near the plotted data. Having students circle the visible data range before making any prediction keeps them anchored to the actual evidence on the graph.
How to Fit These Worksheets Into a Statistics Unit
These resources work at multiple points in a unit, and the format lends itself to short, focused use rather than long independent work stretches. Opening class with a pre-drawn scatter plot and two quick questions — identify the association type, spot any outlier — takes about five minutes and primes students for whatever fuller task follows.
After a direct instruction session on drawing trend lines, one worksheet with two or three scatter plots gives students enough practice to consolidate the technique without hitting diminishing returns. Having them annotate the line directly on the printed graph and write one prediction in context keeps the task tight and easy to collect and review.
For small-group reteach, the worksheets with pre-drawn scatter plots and guiding questions are the most useful starting point. Students in that group read and analyze before they are expected to construct a graph from scratch. That ordering — analysis before construction — lowers the cognitive demand of doing both tasks simultaneously and keeps the conversation focused on interpretation, which is usually where the actual gap lives.
Exit ticket work at the end of a scatter plot lesson fits well with a single question: "Is a linear model reasonable for this data set? Justify your answer in one sentence." That format gives direct formative evidence — who can evaluate a visual pattern and explain it, and who still needs another round of practice before the unit assessment.
Standard Alignment
These worksheets address the Common Core State Standards cluster 8.SP.A, which governs bivariate data analysis at the grade 8 level. The three standards most directly covered are:
- 8.SP.A.1 — Construct and interpret scatter plots for bivariate measurement data to investigate patterns of association between two quantities, including clustering, outliers, and positive, negative, or no association.
- 8.SP.A.2 — Know that straight lines are widely used to model relationships between two quantitative variables, and informally fit a straight line to data that suggest a linear association.
- 8.SP.A.3 — Use the equation of a linear model to solve problems in the context of bivariate measurement data, interpreting slope and intercept in context.
Teachers using 8th grade scatter plots and lines of best fit worksheets pdf as part of a CCSS-aligned sequence typically introduce this cluster in the second semester, after students have built fluency with linear relationships in 8.EE and 8.F. That placement matters — students need a working understanding of slope and linearity before trend line interpretation makes sense. The 8.SP.A standards assume that prior knowledge and extend it into data-specific reasoning, which is exactly where these worksheets operate.
Adjusting These Worksheets for Different Student Levels
The most practical adjustment for scatter plot work is axis setup. Students who are still building graphing fluency benefit from worksheets where axes come pre-labeled and scaled, so their attention stays on the data relationship rather than on scale selection. More advanced students should set up the axes themselves — choosing a scale for a data set that runs from 45 to 320 on the y-axis is a genuine mathematical decision, and it is one many 8th graders have not made before.
For students who need more interpretation support, sentence frames embedded directly in the worksheet reduce the blank-page problem without removing the thinking. A frame like "The scatter plot shows a ___ association because the points generally ___" keeps students writing in mathematical terms. The content still has to come from their own analysis — the frame just removes the entry barrier of not knowing how to begin.
On the extension end, students ready for a deeper challenge can compare two scatter plots from different data sets and write an argument for which one is better modeled by a linear trend. That task requires evaluation, not just description, and it naturally opens up conversation about correlation strength without requiring formal notation or statistics vocabulary the course hasn't introduced yet.
Frequently Asked Questions
What prior knowledge do students need before working with these resources?
Students should be comfortable plotting ordered pairs on a coordinate plane and have some exposure to linear relationships — enough to recognize that a positive slope rises from left to right. Formal equation work is not required for the introductory worksheets, but students who have worked with slope and rate of change in 8.EE and 8.F will be better positioned to interpret a trend line informally and connect it to what they already know.
Can these worksheets be used for homework?
Yes. Students need only a ruler and a pencil, and the tasks are self-contained. One practical note: the interpretation questions — where students explain associations or justify predictions in writing — tend to produce stronger responses when students have had at least one class discussion about scatter plot vocabulary first. Sending the first worksheet home before any instruction usually returns graphing without explanation, which misses the point of the exercise.
How many data points work best for 8th grade scatter plot practice?
Most 8th grade practice lands in the range of 10 to 20 data points. Fewer than 8 makes it difficult to discuss clustering or judge whether a linear model is reasonable. More than 25 becomes time-consuming to plot by hand without adding proportional instructional value. Each worksheet in this set stays within that range, keeping the plotting task manageable while giving students enough information to identify a meaningful pattern.
Do these worksheets include prediction tasks?
Each worksheet that includes a line of best fit also asks students to use it for at least one prediction and to evaluate whether that prediction is reasonable given the visible data range. The 8th grade scatter plots and lines of best fit worksheets pdf in this set treat prediction as an interpretive skill — students explain their reasoning in context rather than simply reading a y-value off the graph.
Clear All