


1 / 12
0
Views
0
Downloads


0.0
0
Save
0 Likes
Scatter Plots Practice Worksheet
0 Views
0 Downloads
Paste this activity's link or code into your existing LMS (Google Classroom, Canvas, Teams, Schoology, Moodle, etc.).
Students can open and work on the activity right away, with no student login required.
You'll still be able to track student progress and results from your teacher account.
Information
Description
What It Is:
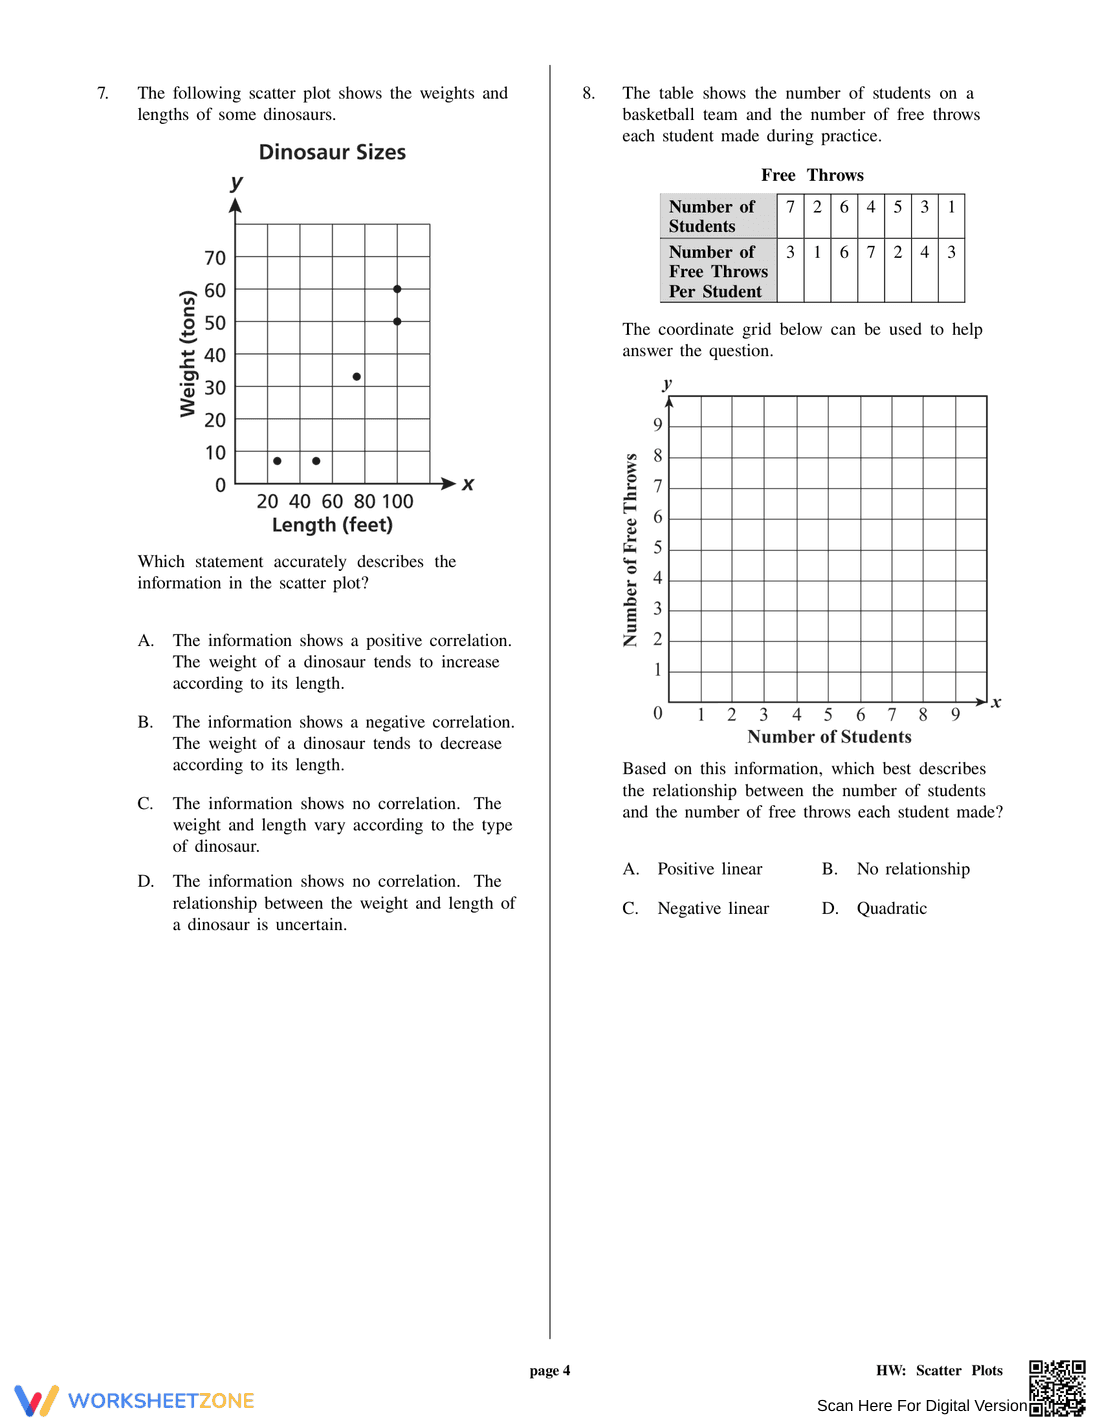
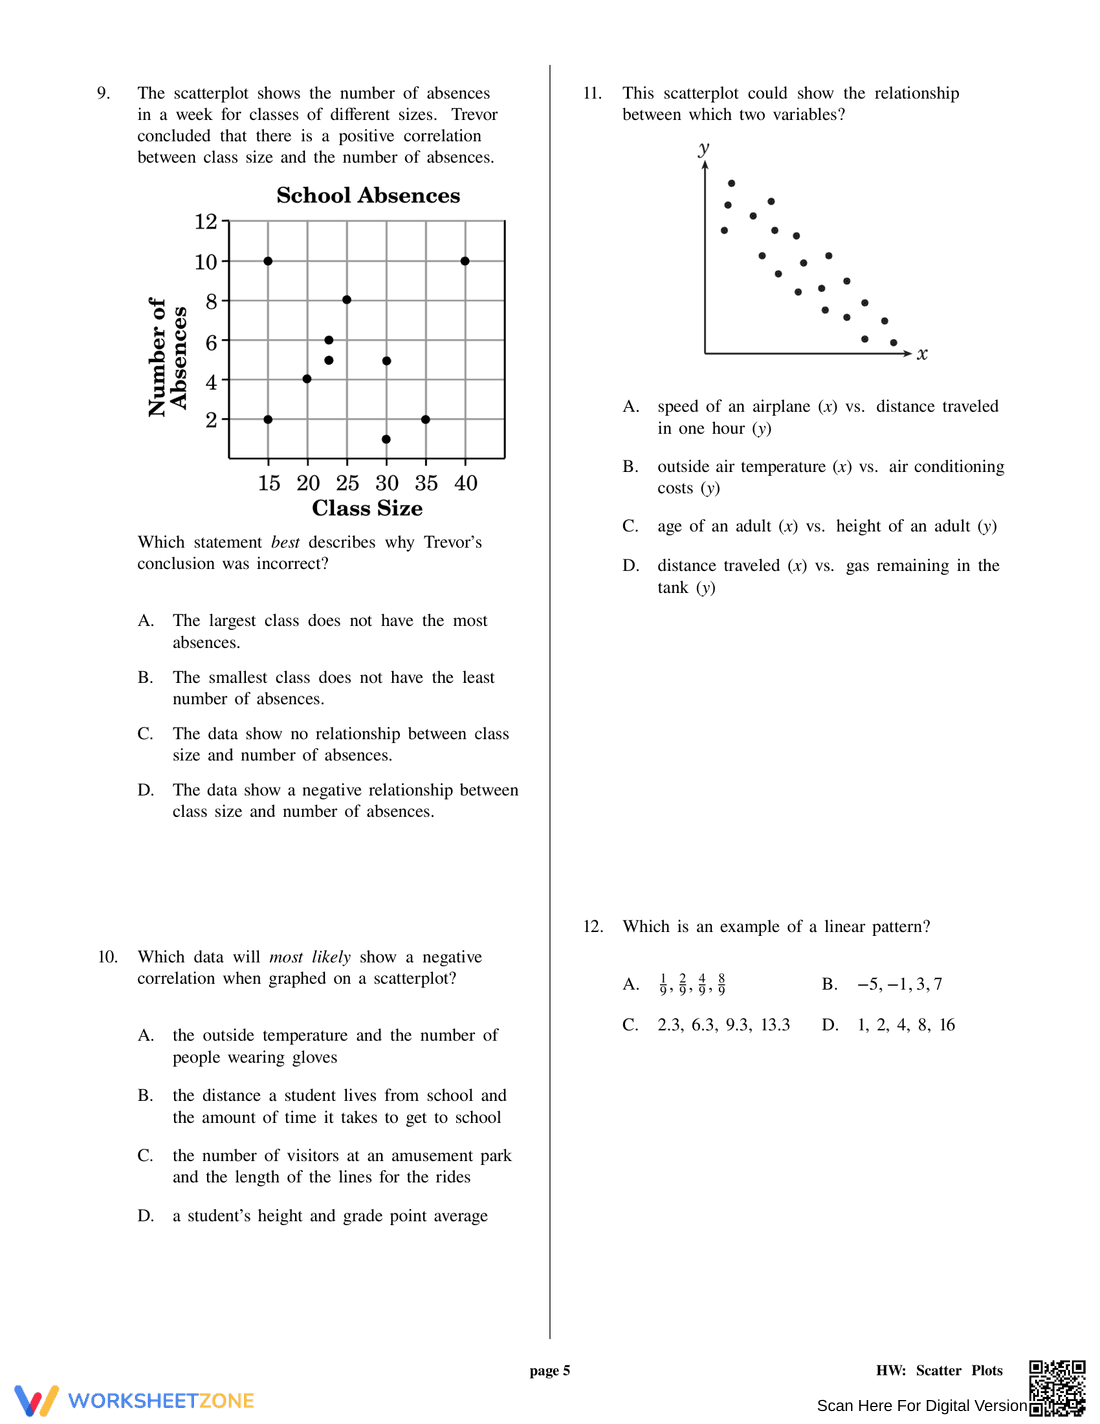
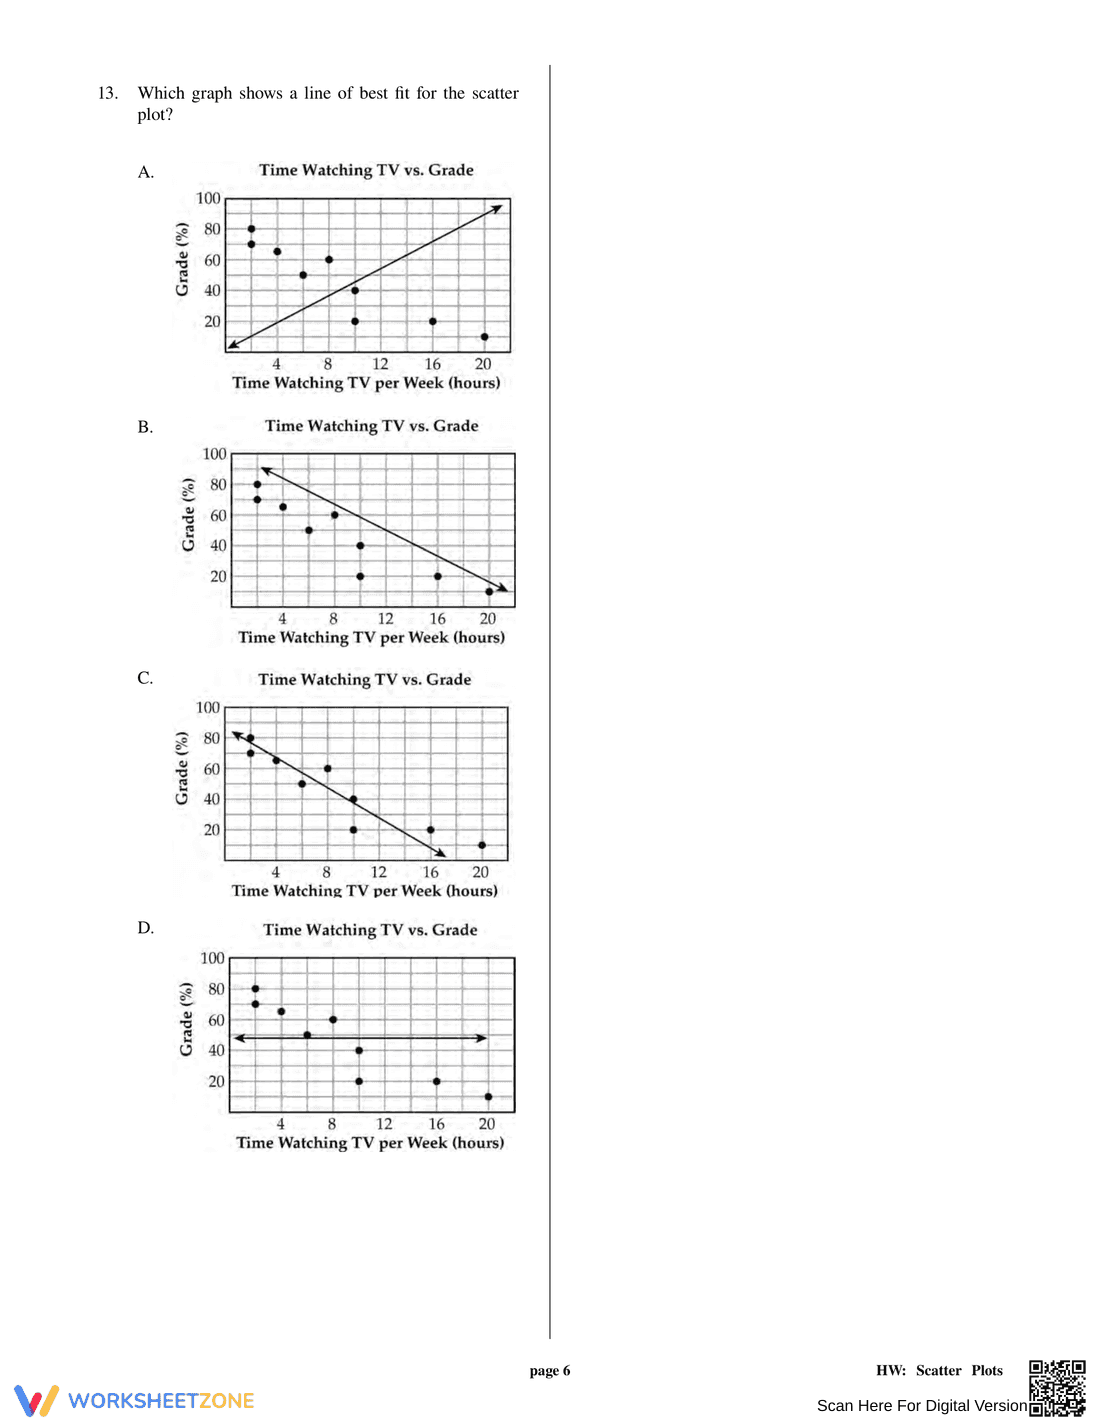
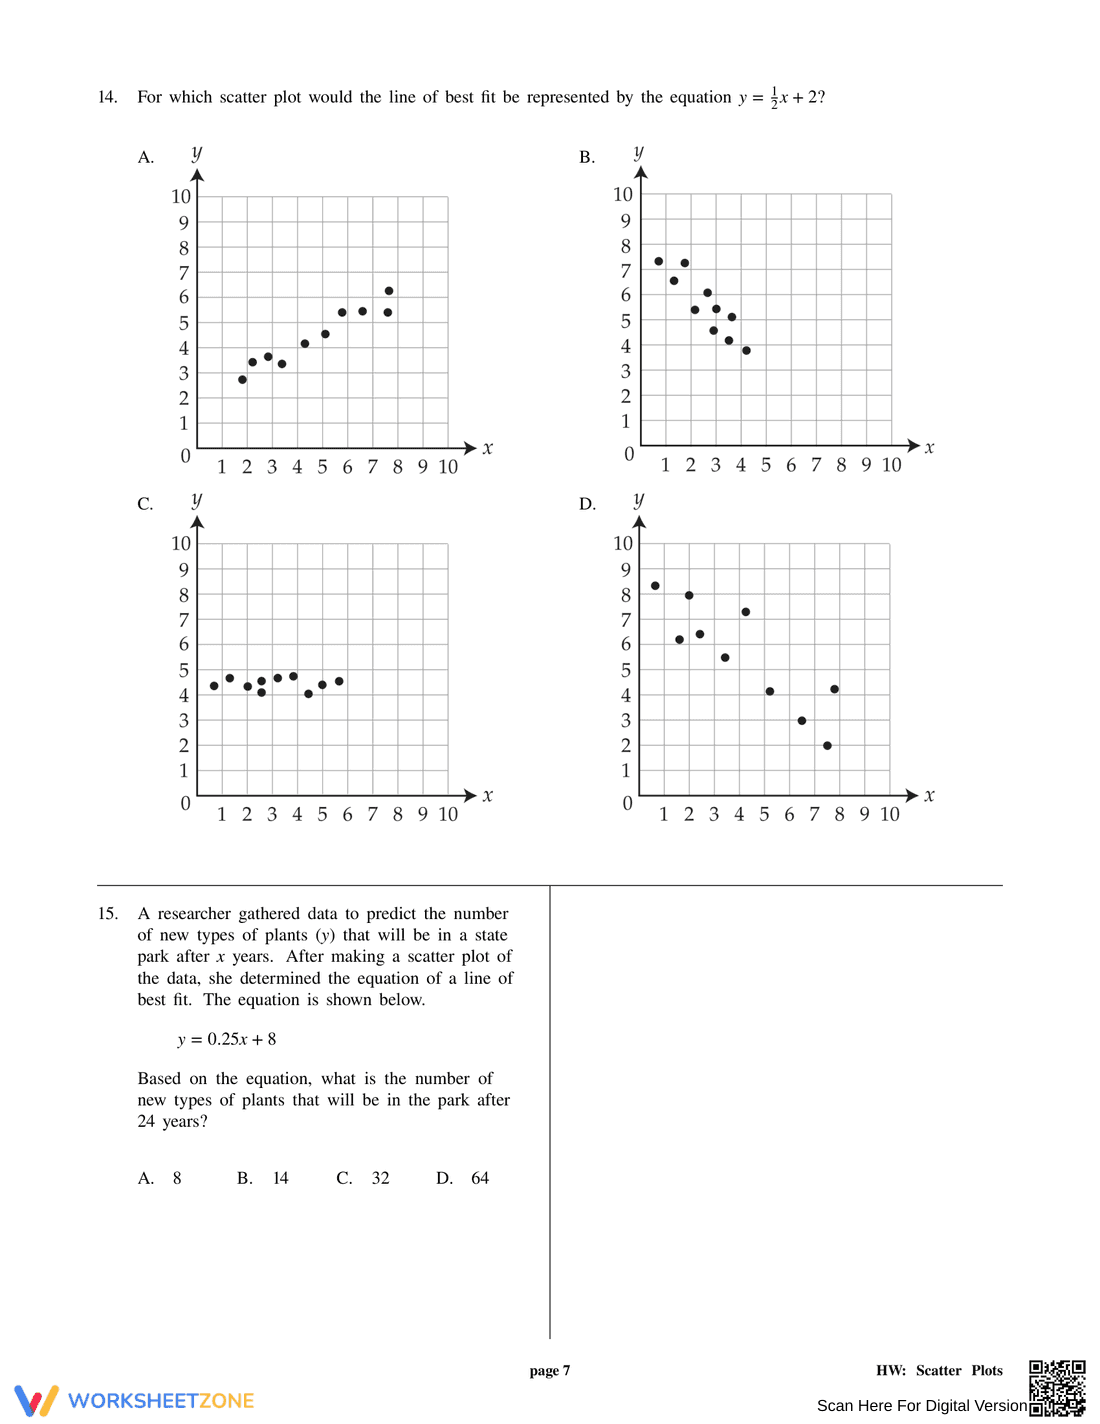
A scatter plots worksheet that asks students to analyze real-world data graphs and identify relationships between two variables.
Why Use It:
This worksheet helps students develop data interpretation skills by recognizing trends, understanding correlation, and drawing conclusions from scatter plot visuals.
How to Use It:
• Analyze scatter plots showing real-life situations
• Identify whether the relationship shows a positive, negative, or no trend
• Choose correct statements that describe data behavior
• Practice interpreting graphical data without calculations
Grade Suitability:
Best suited for Grades 6–8.
• Upper elementary students learning graph interpretation
• Middle school students practicing data analysis skills
Target Users:
Math teachers, students, and parents supporting lessons on data relationships and graphing.