


1 / 4
0
Views
0
Downloads
0.0
0
Save
0 Likes
Scatter Plots: Lines of Best Fit Practice
0 Views
0 Downloads
Paste this activity's link or code into your existing LMS (Google Classroom, Canvas, Teams, Schoology, Moodle, etc.).
Students can open and work on the activity right away, with no student login required.
You'll still be able to track student progress and results from your teacher account.
Information
Description
What It Is:
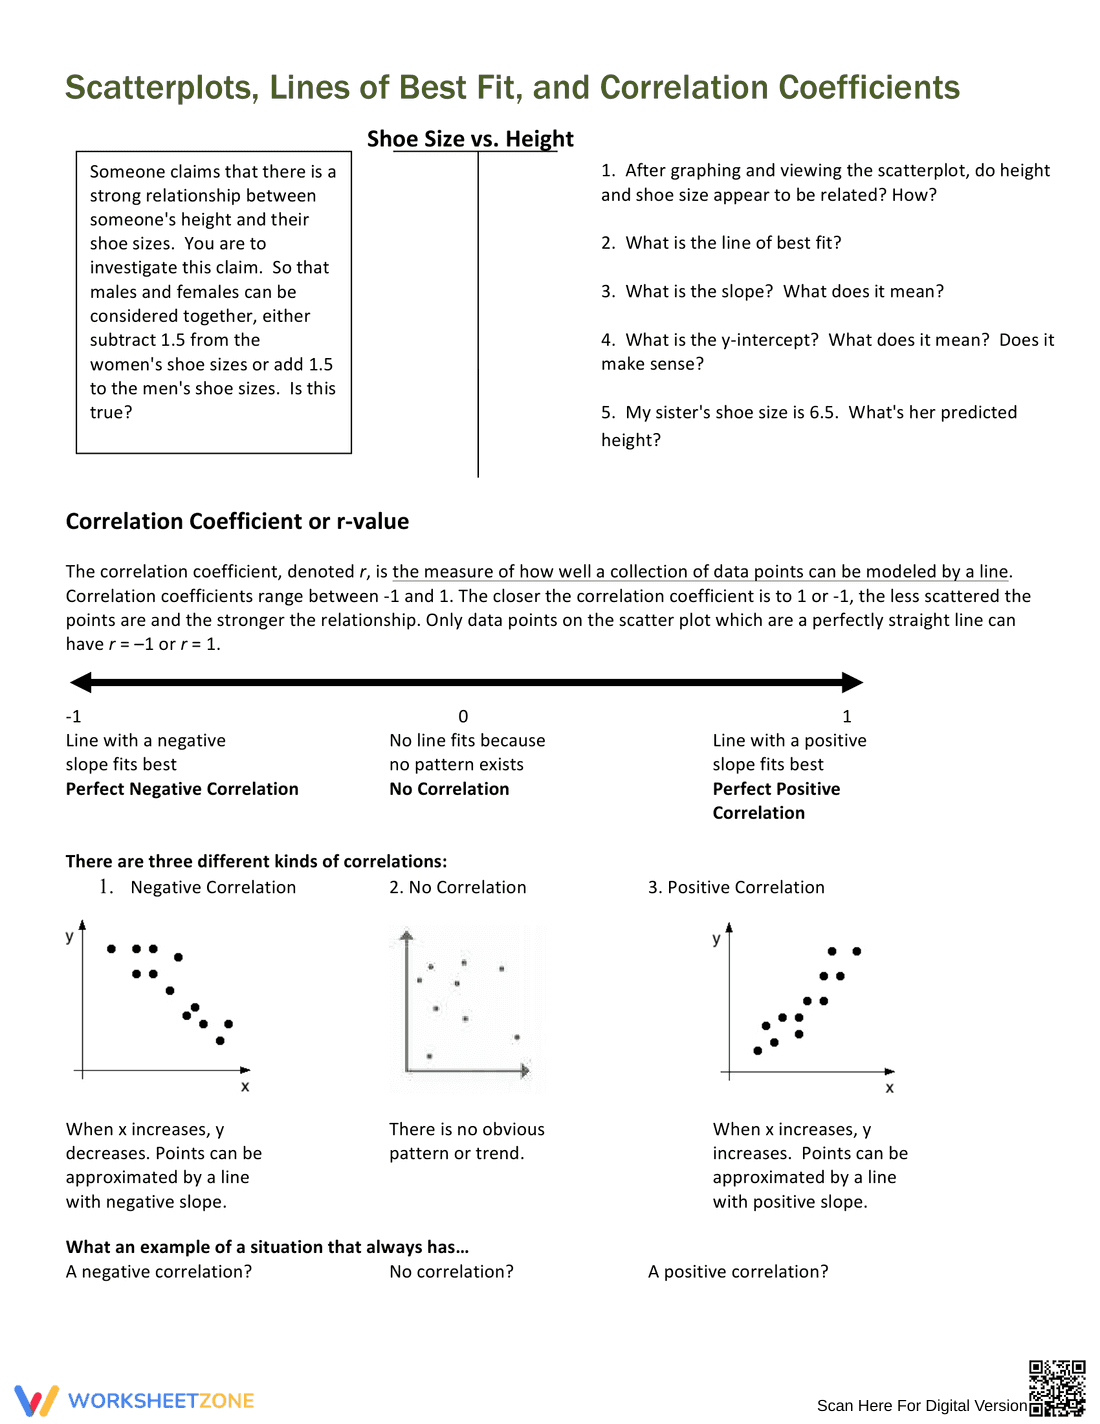
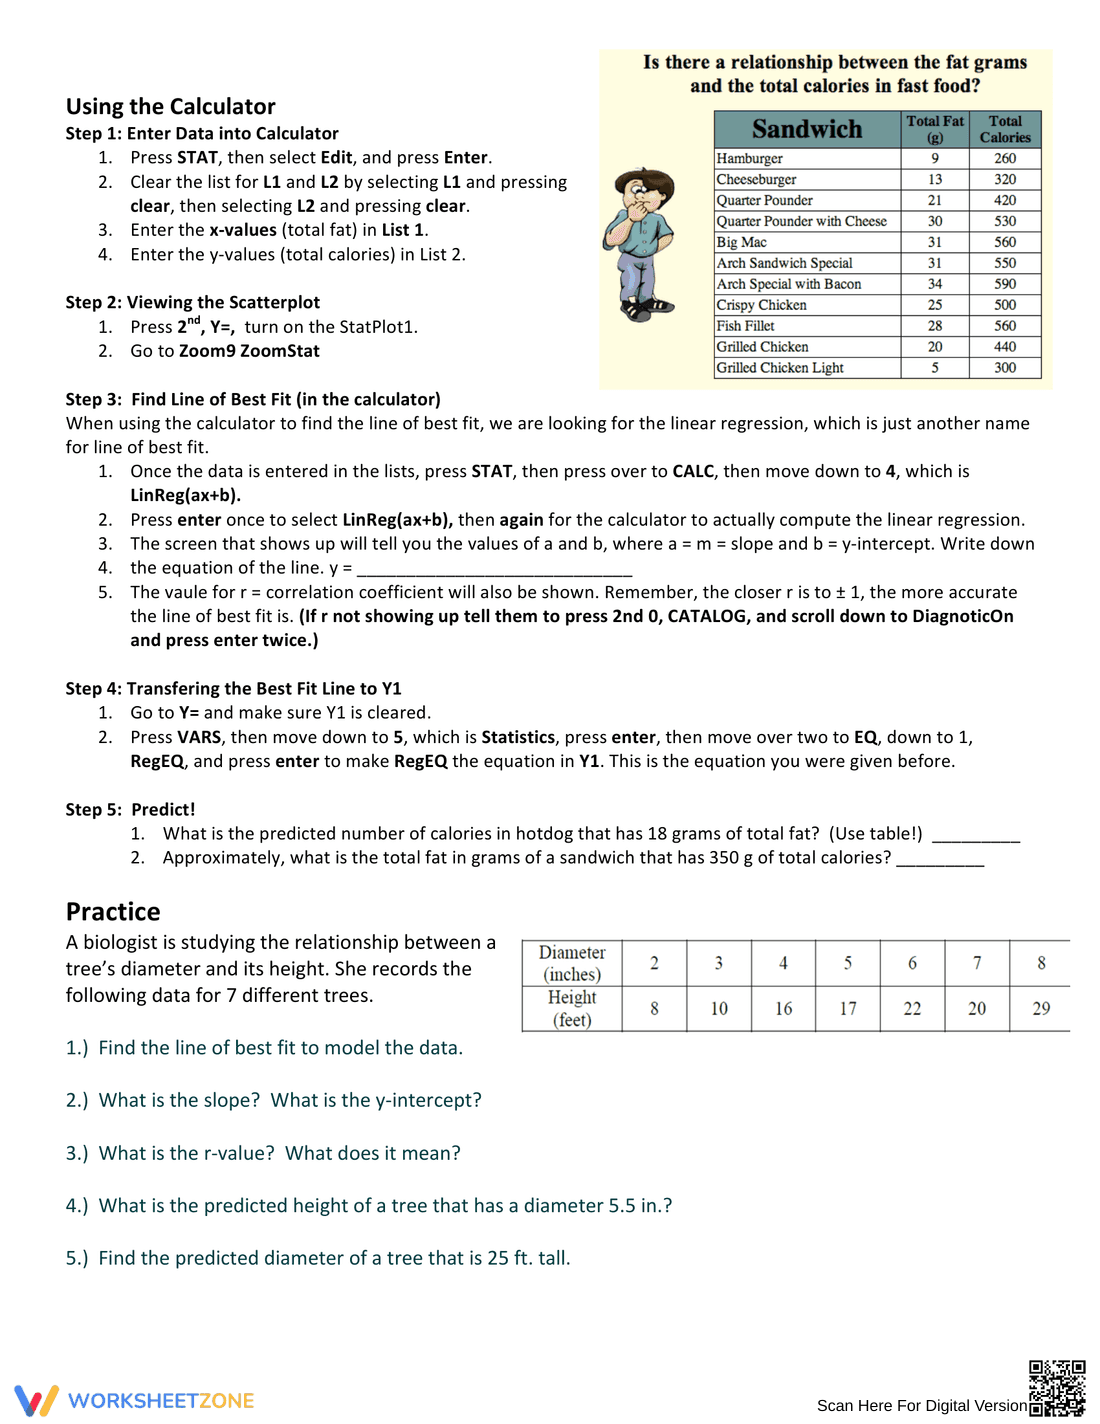
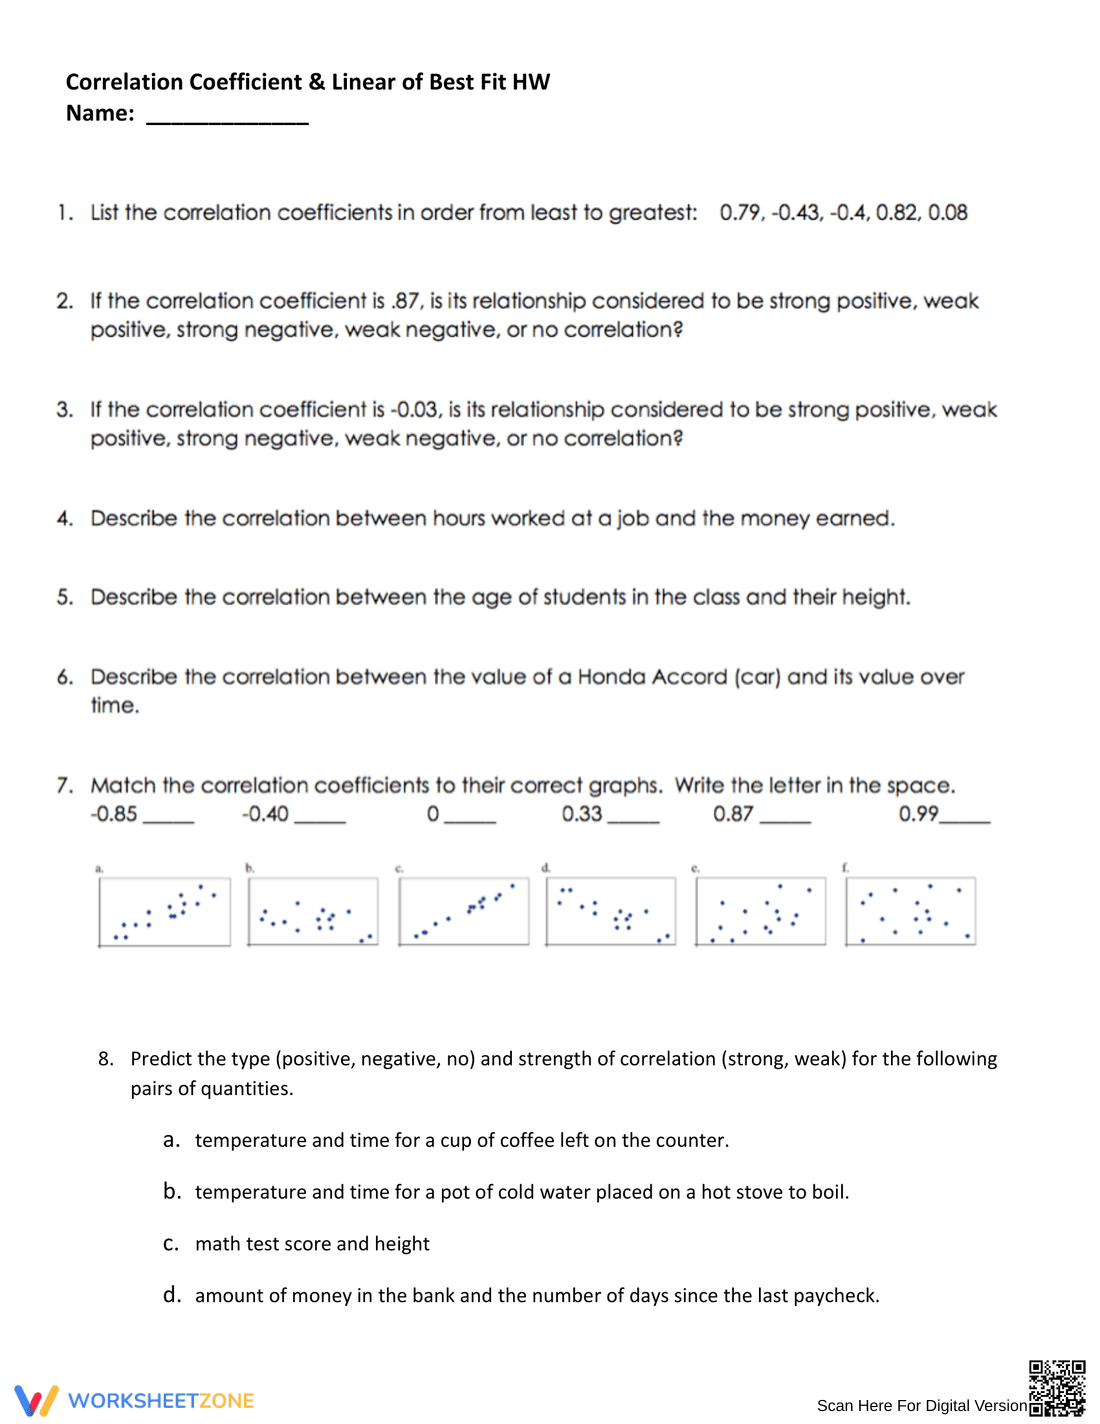
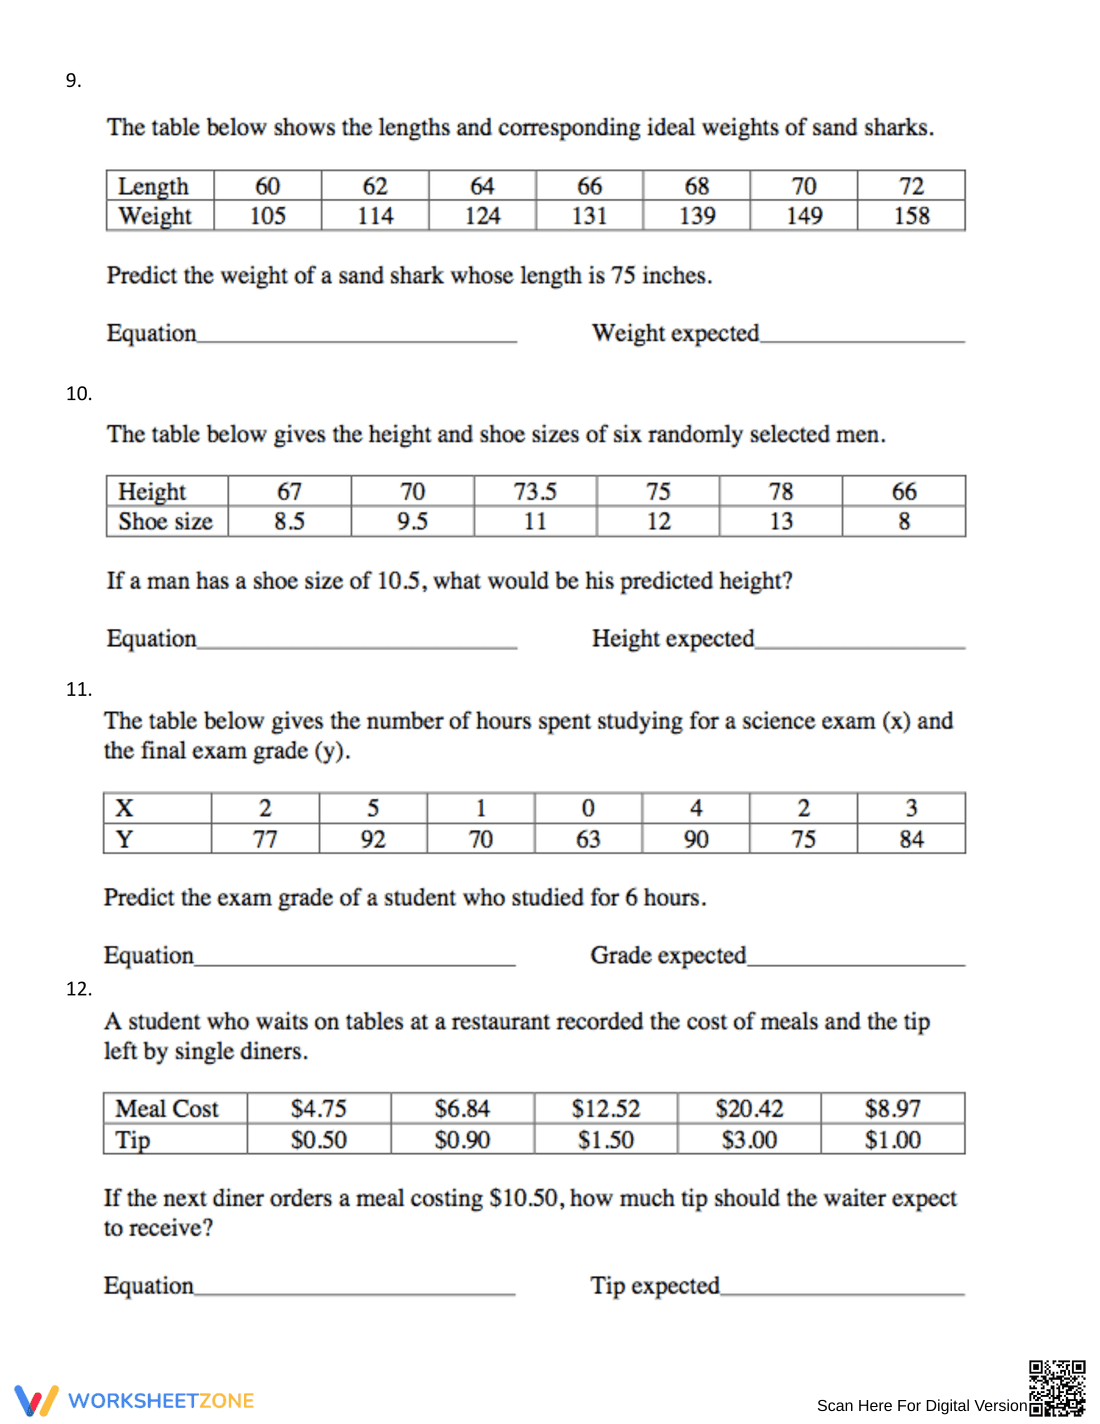
This is an educational worksheet focusing on scatterplots, lines of best fit, and correlation coefficients. It presents information about correlation coefficients (r-value) ranging from -1 to 1, illustrating negative, no, and positive correlations with scatterplot examples. There are questions asking about the relationship between shoe size and height, including finding the line of best fit, slope, and y-intercept.
Grade Level Suitability:
This worksheet is suitable for high school students, specifically grades 9-12. The concepts of scatterplots, correlation coefficients, and linear regression are typically introduced at this level. The application of these concepts to real-world data, like shoe size and height, makes it appropriate for this age group.
Why Use It:
This worksheet helps students understand the relationship between two variables using scatterplots and correlation coefficients. It teaches them how to interpret the strength and direction of a correlation, and how to find the line of best fit. It also promotes critical thinking by asking students to analyze real-world scenarios and make predictions based on the data.
How to Use It:
Students should first read the introductory information about correlation coefficients. Then, they should analyze the scatterplot examples to understand the different types of correlations. Next, they should attempt to answer the questions about shoe size and height, which involve graphing data, finding the line of best fit, and interpreting the slope and y-intercept.
Target Users:
This worksheet is designed for high school students learning about statistics and data analysis. It is also useful for teachers who want to introduce or reinforce the concepts of scatterplots, correlation, and linear regression. It can be used as a classroom activity, homework assignment, or review exercise.