


1 / 16
0
Views
0
Downloads


0.0
0
Save
0 Likes
Scatter Plots & Line of Best Fit Practice
0 Views
0 Downloads
Paste this activity's link or code into your existing LMS (Google Classroom, Canvas, Teams, Schoology, Moodle, etc.).
Students can open and work on the activity right away, with no student login required.
You'll still be able to track student progress and results from your teacher account.
Information
Description
What It Is:
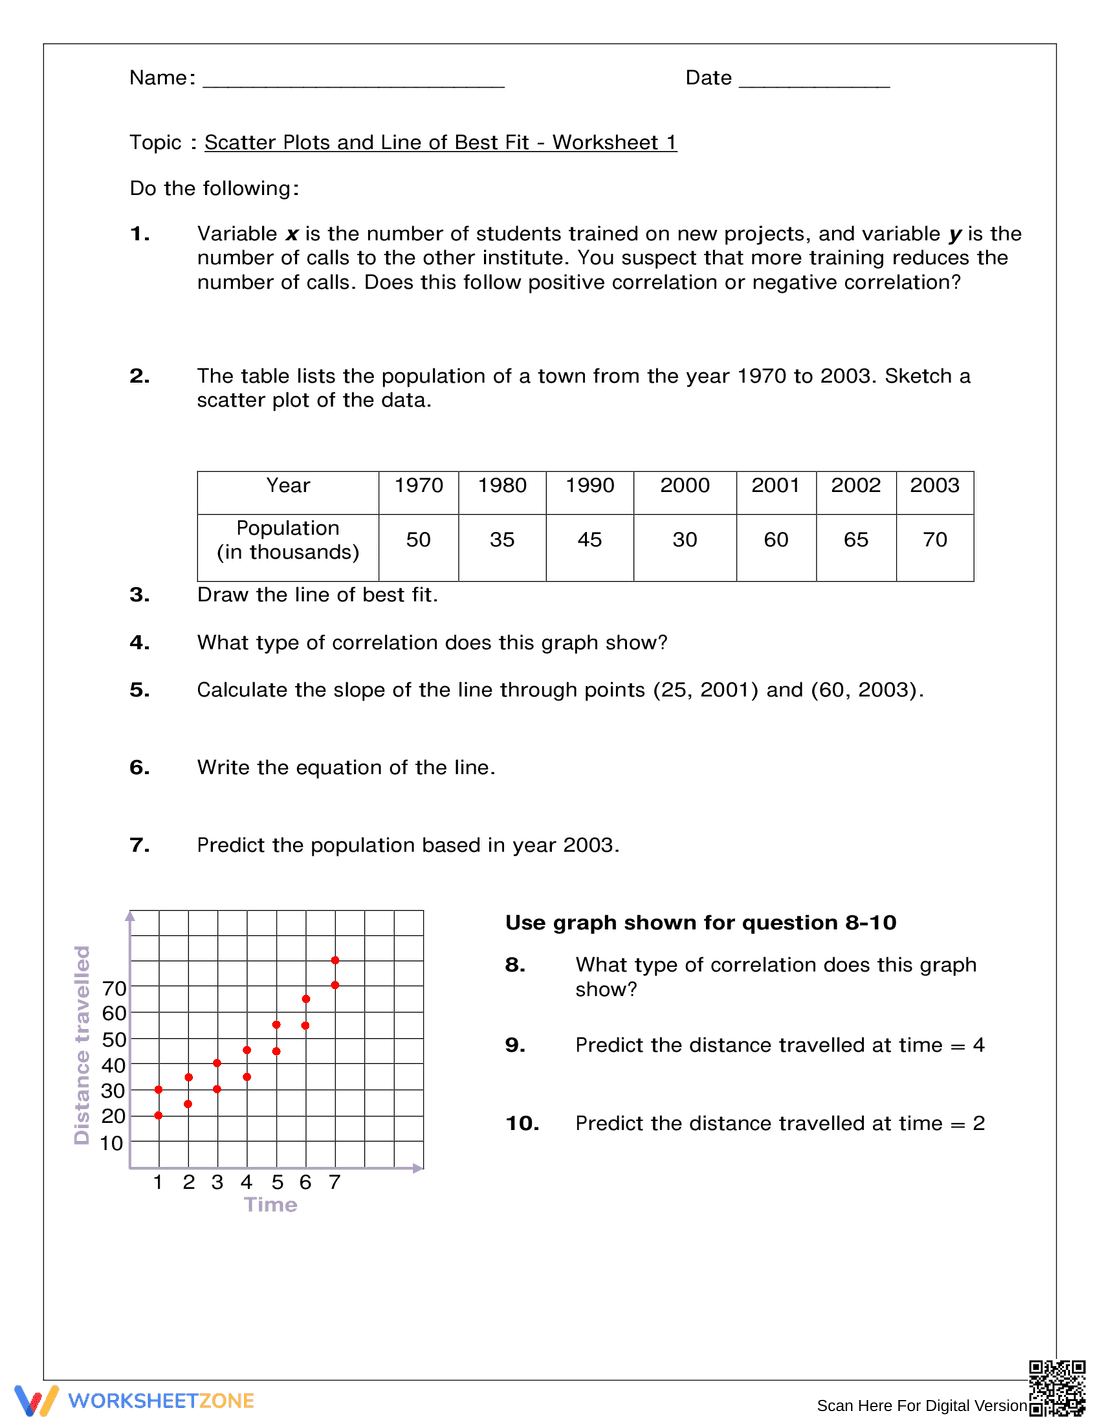
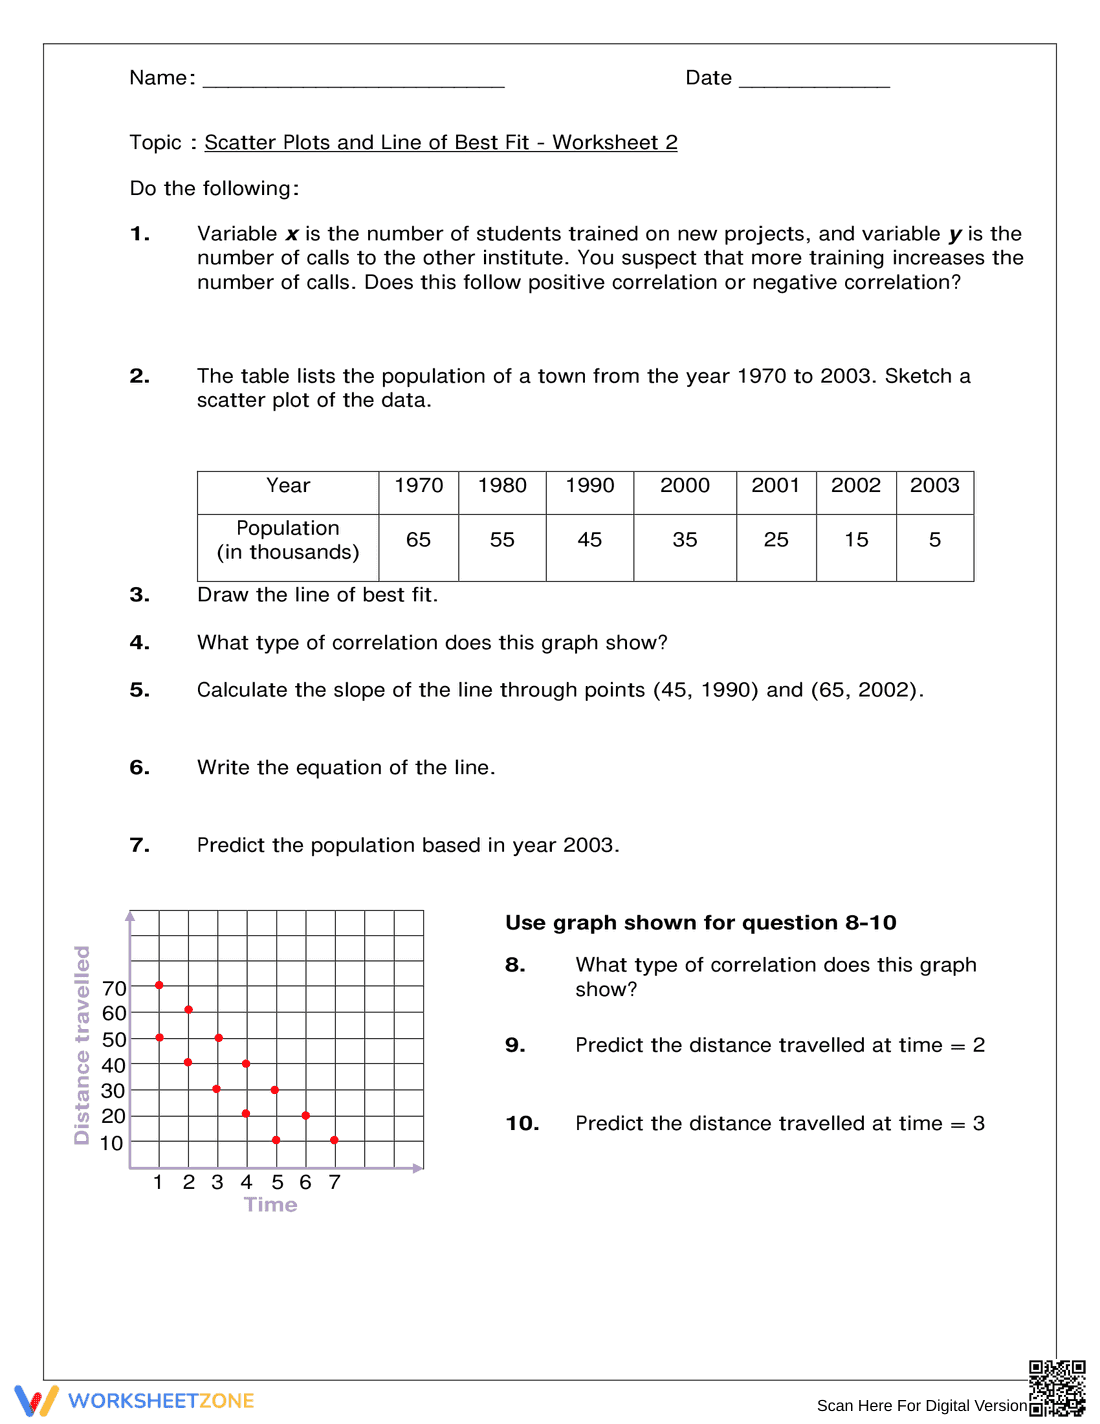
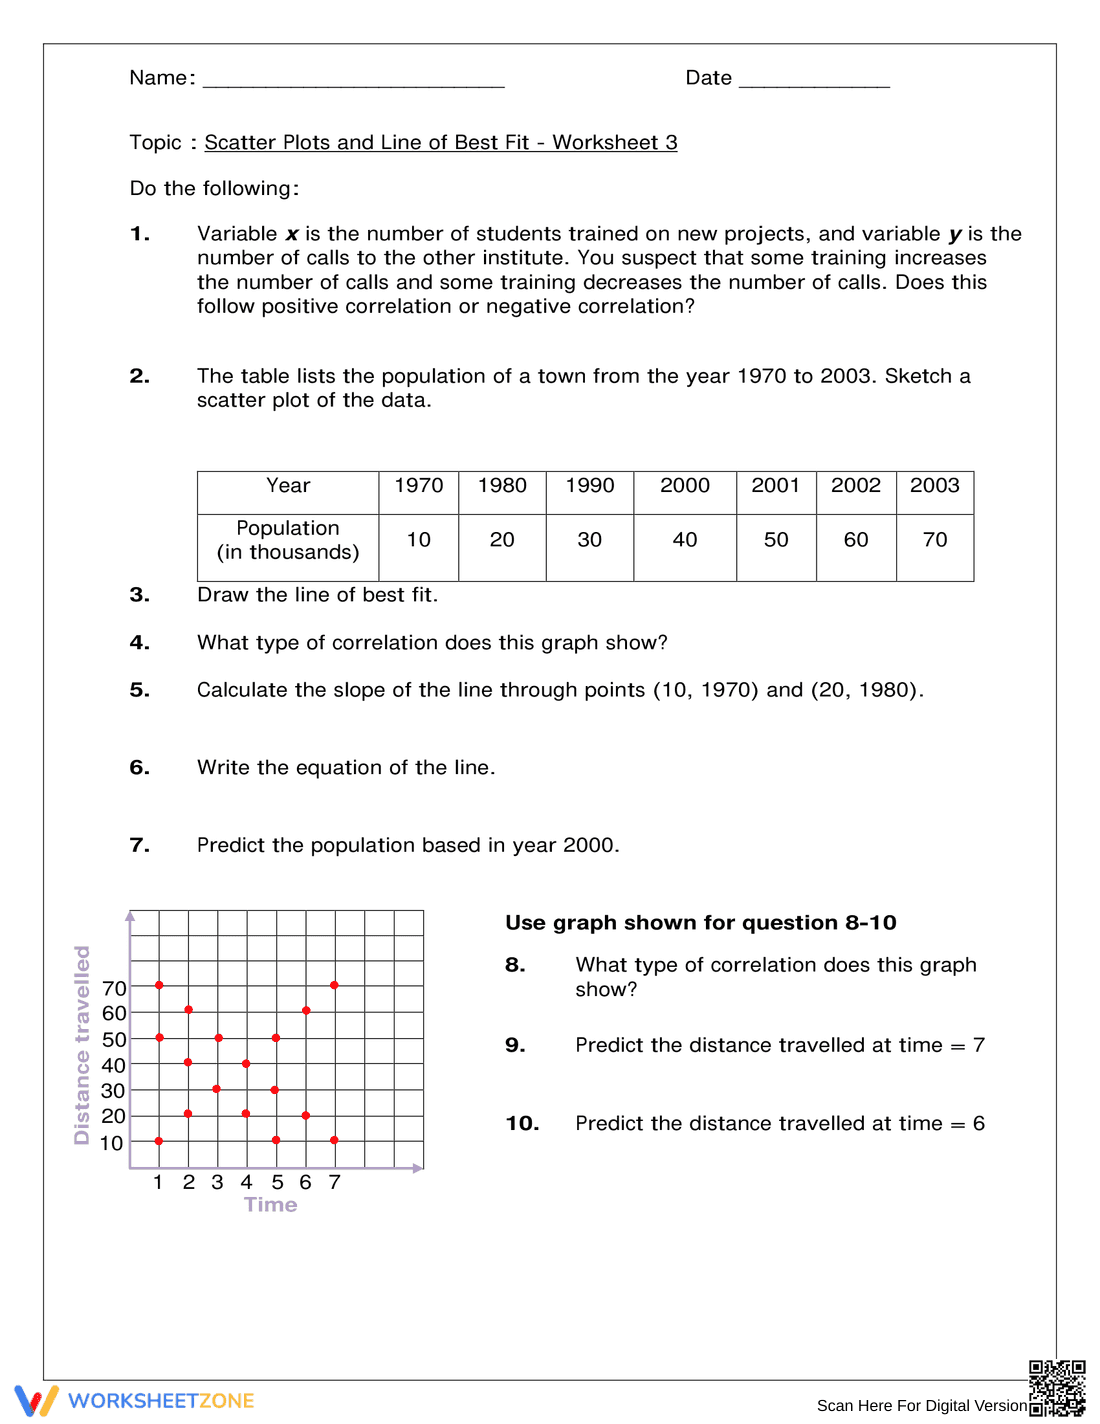
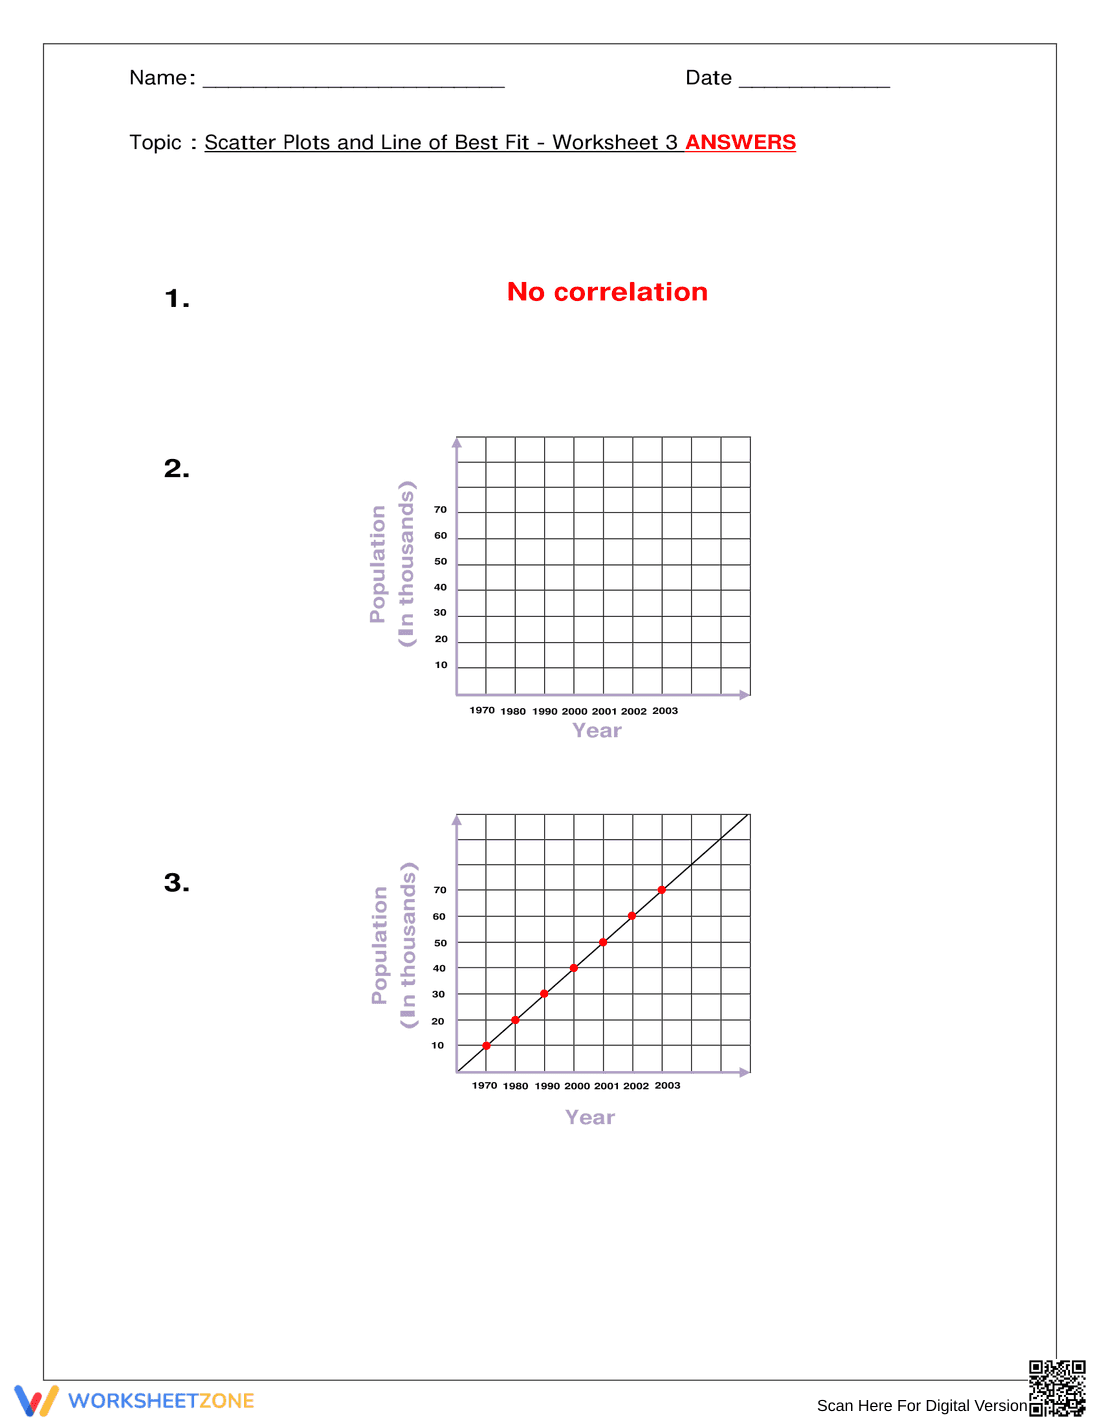
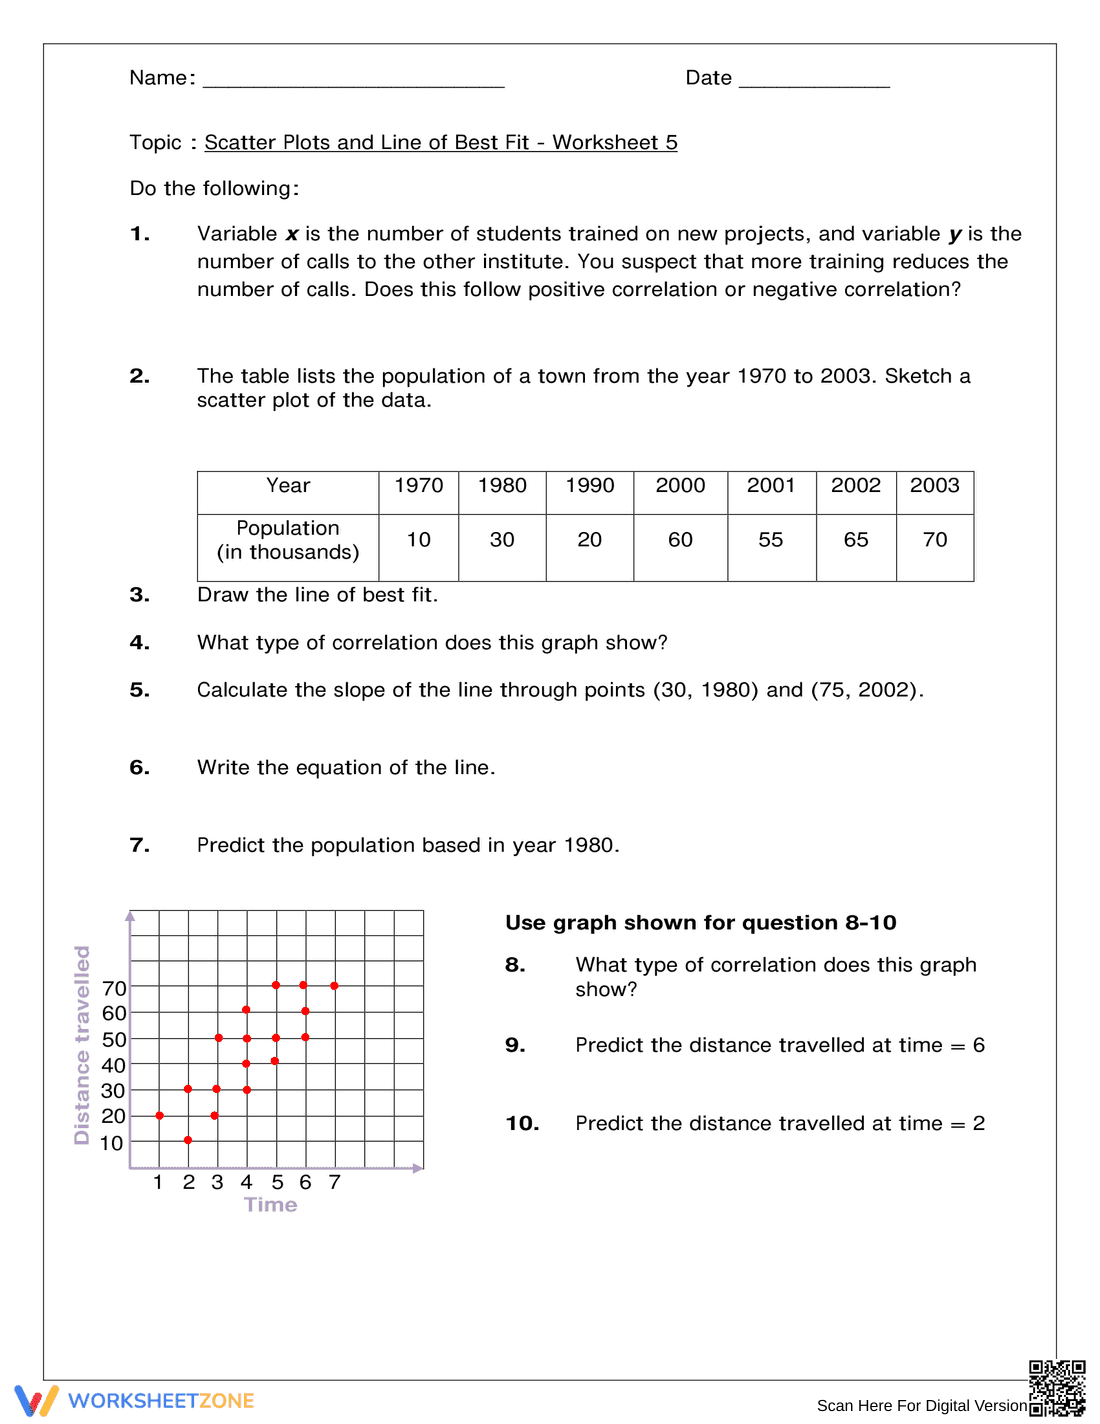
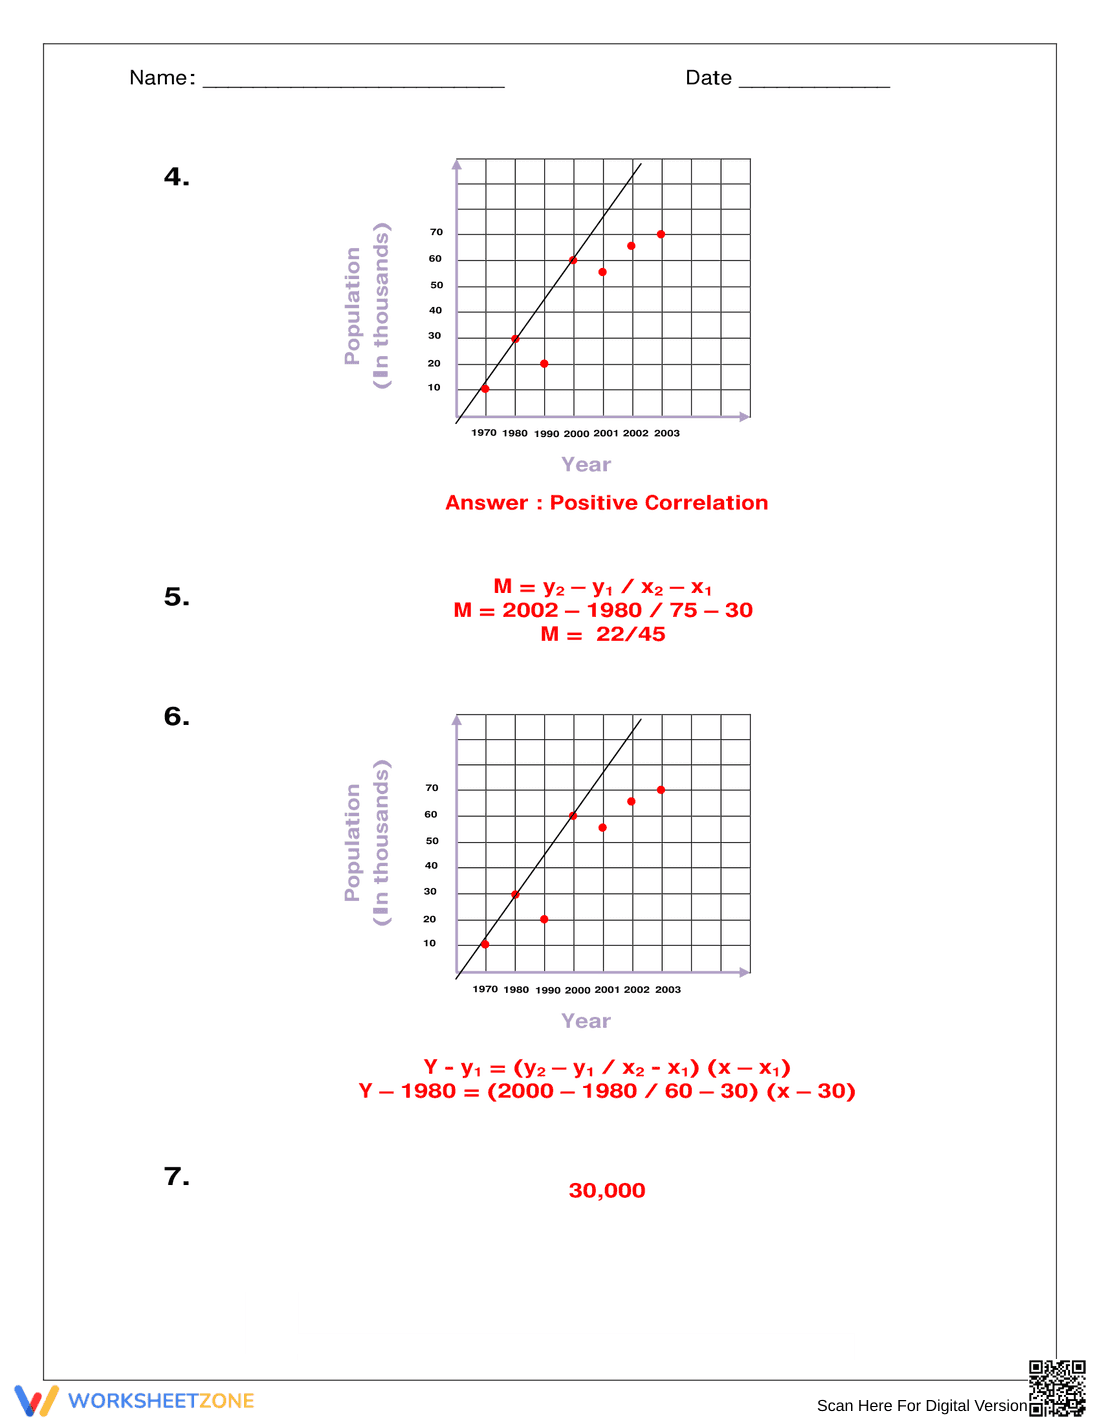
A scatter plots and line of best fit worksheet that guides students through interpreting data tables, sketching scatter plots, analyzing correlation, and writing linear equations.
Why Use It:
This worksheet supports data analysis and algebra readiness by helping students understand correlation, slope, and prediction using real-world contexts such as population growth and distance over time.
How to Use It:
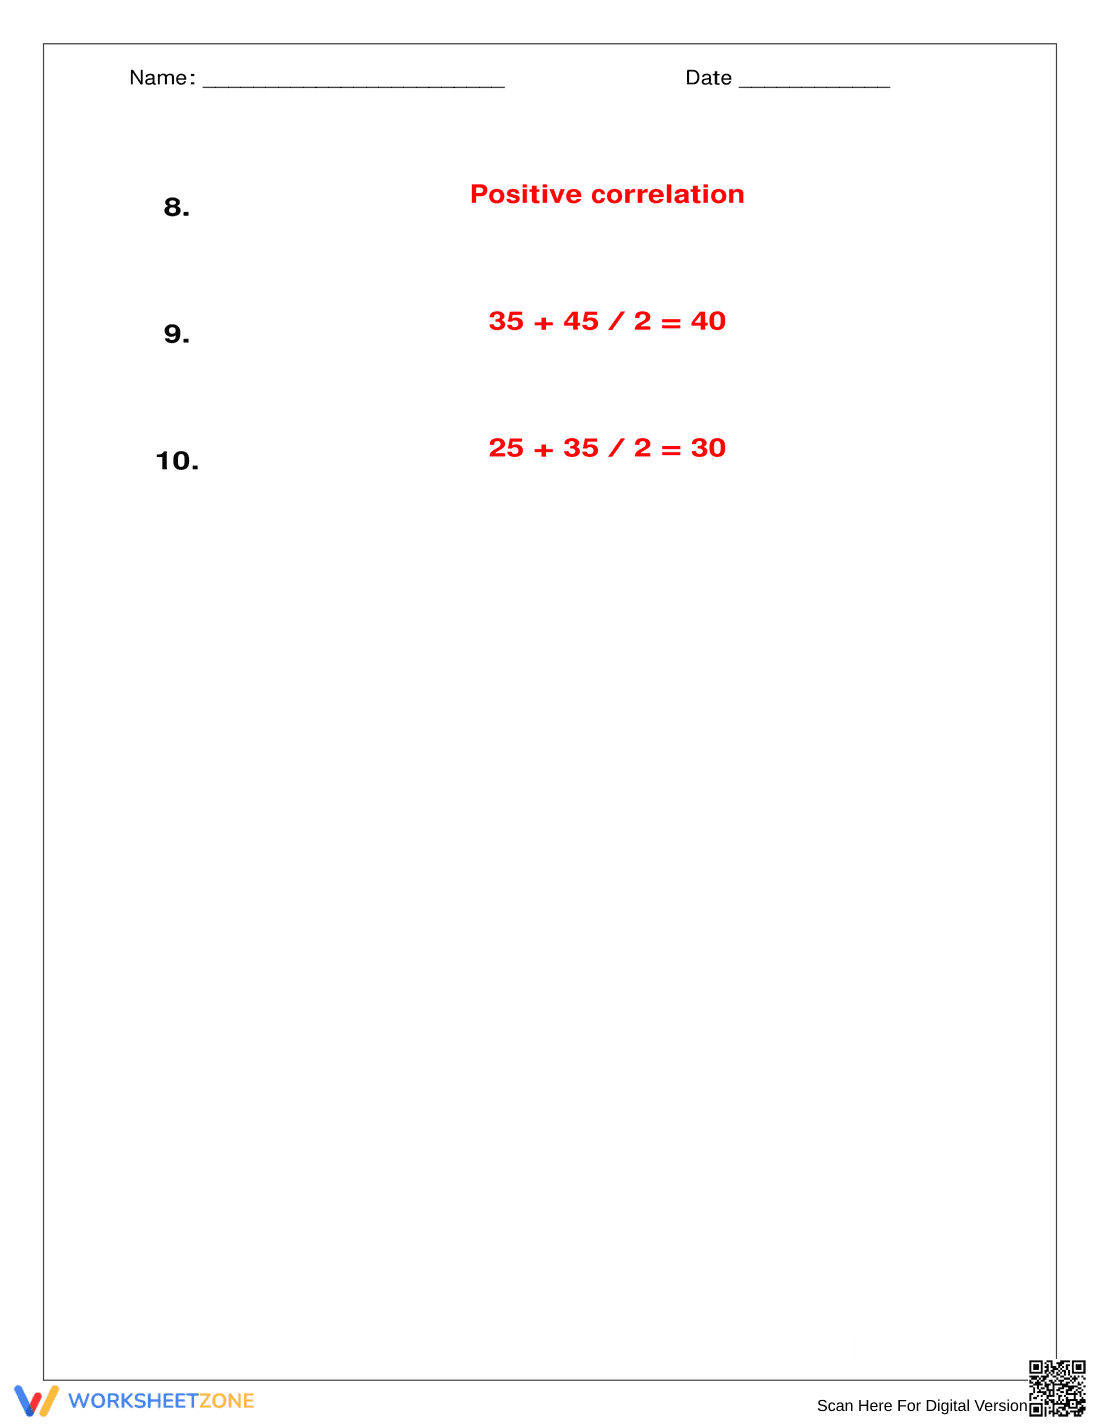
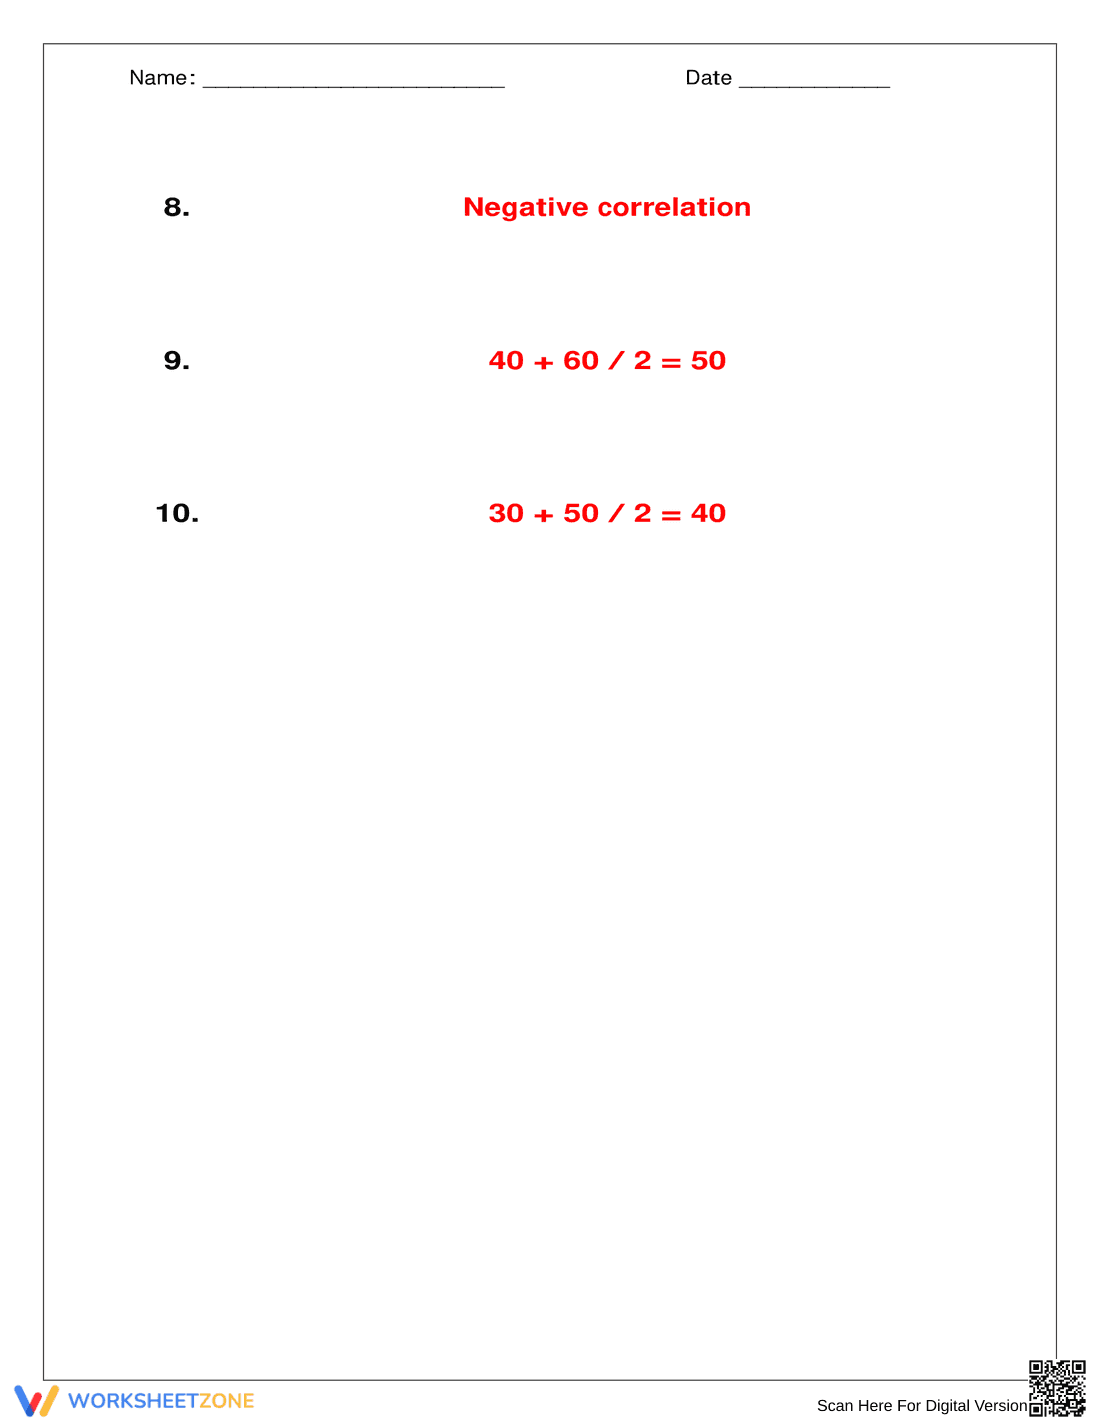
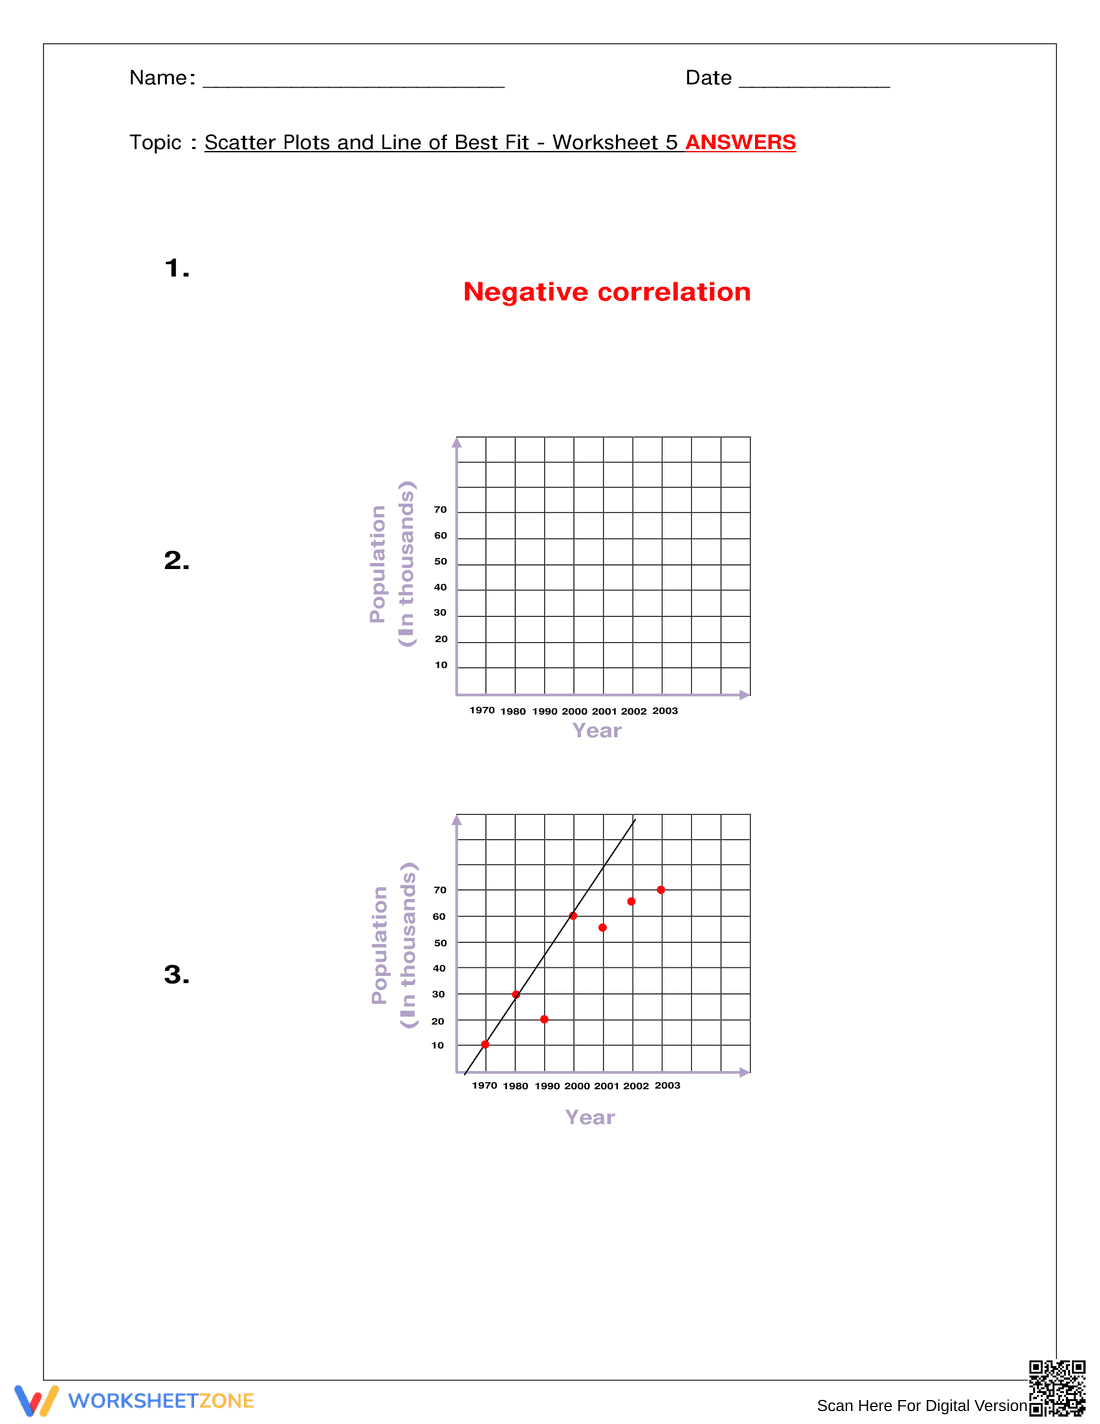
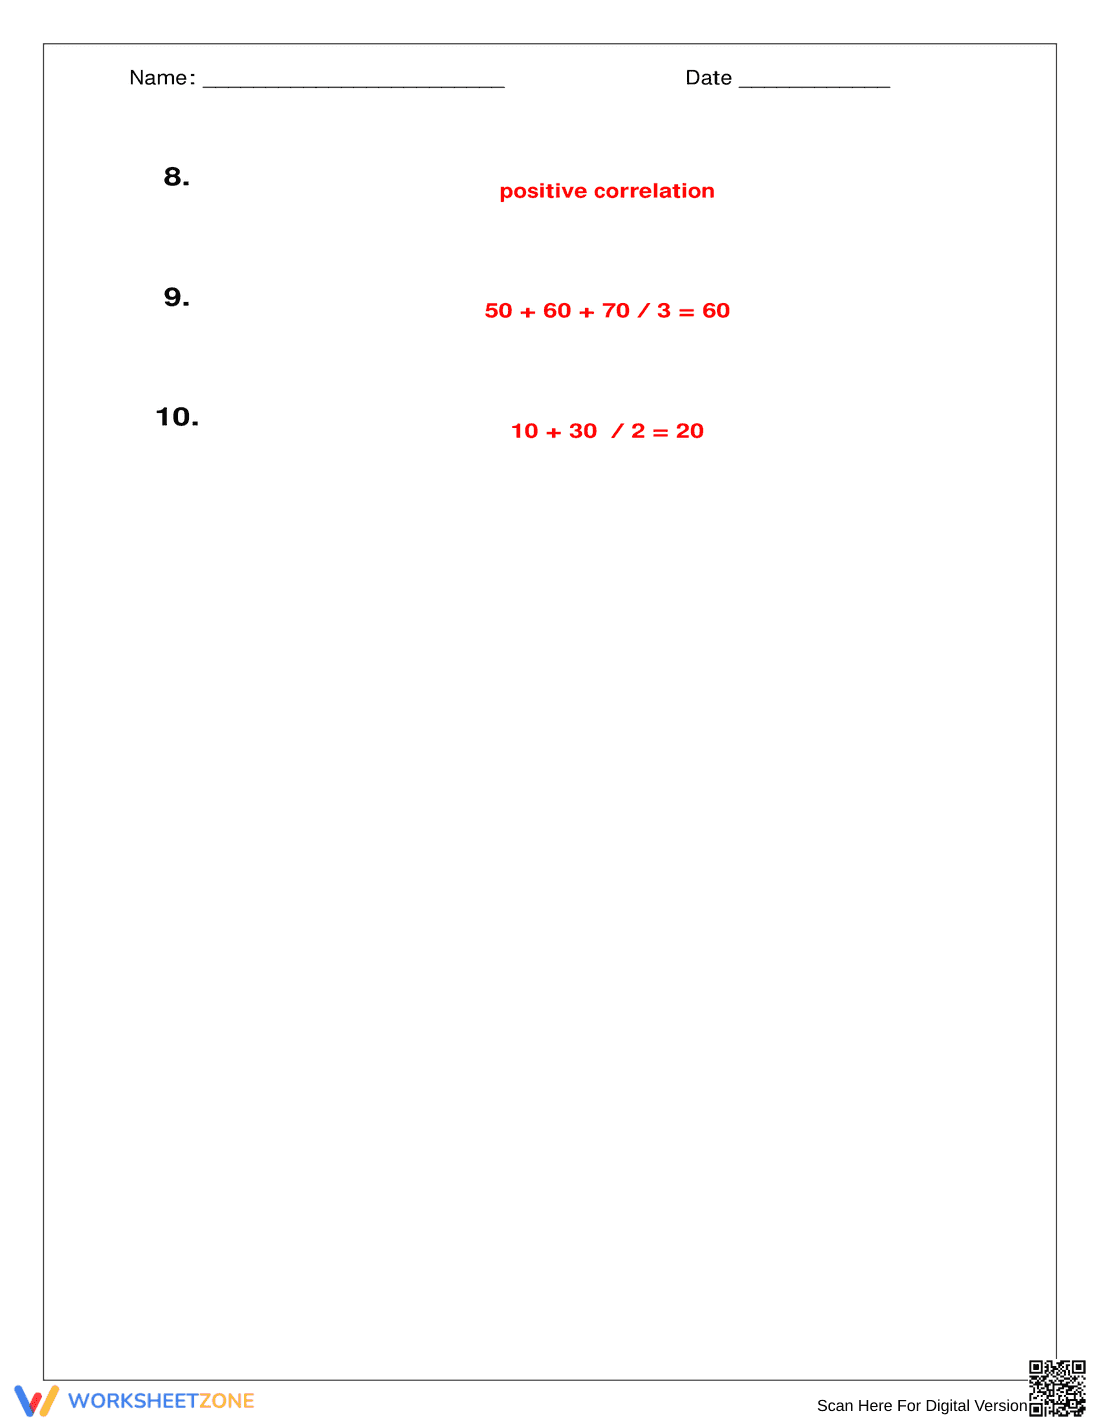
• Identify positive or negative correlation between variables
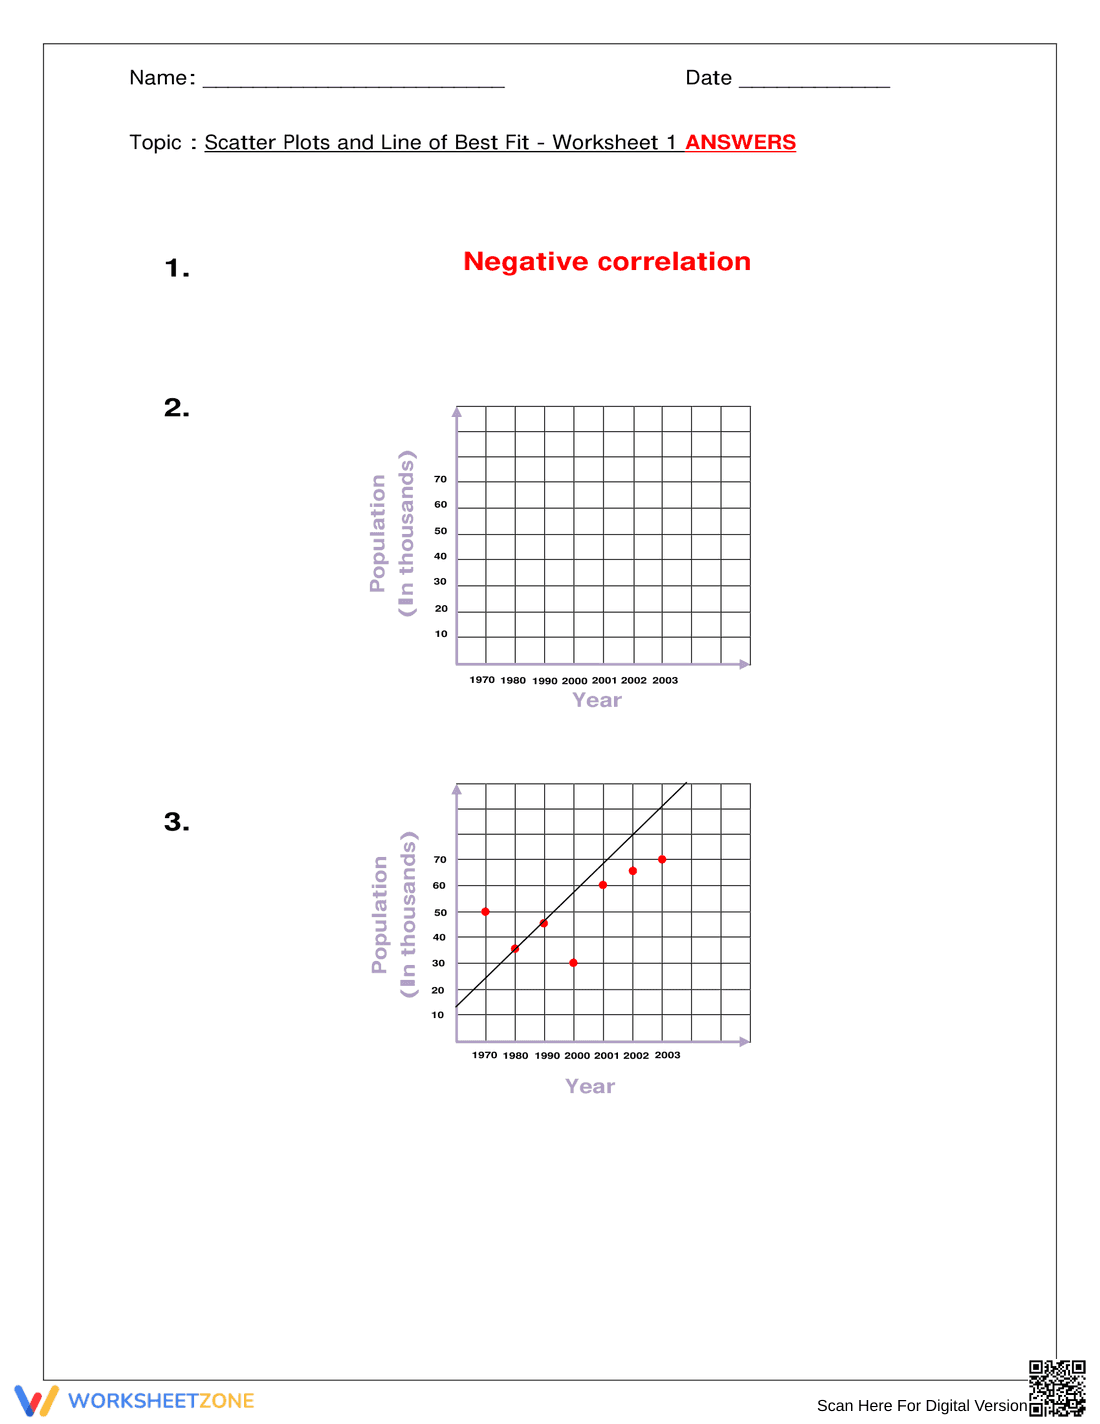
• Create scatter plots from data tables
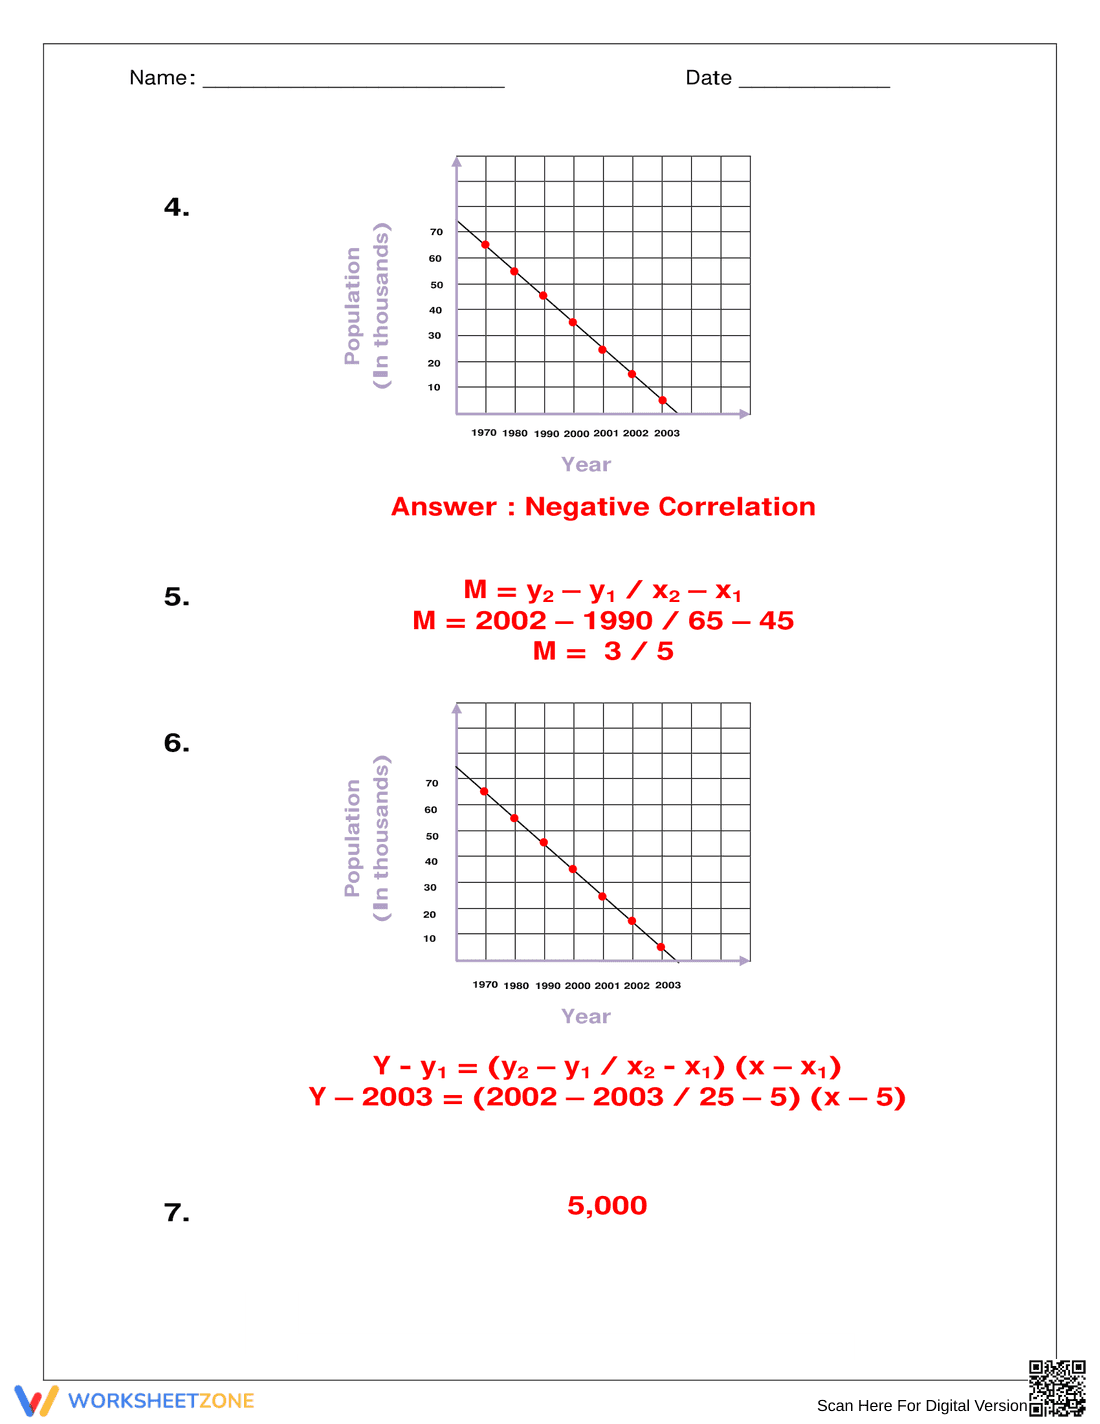
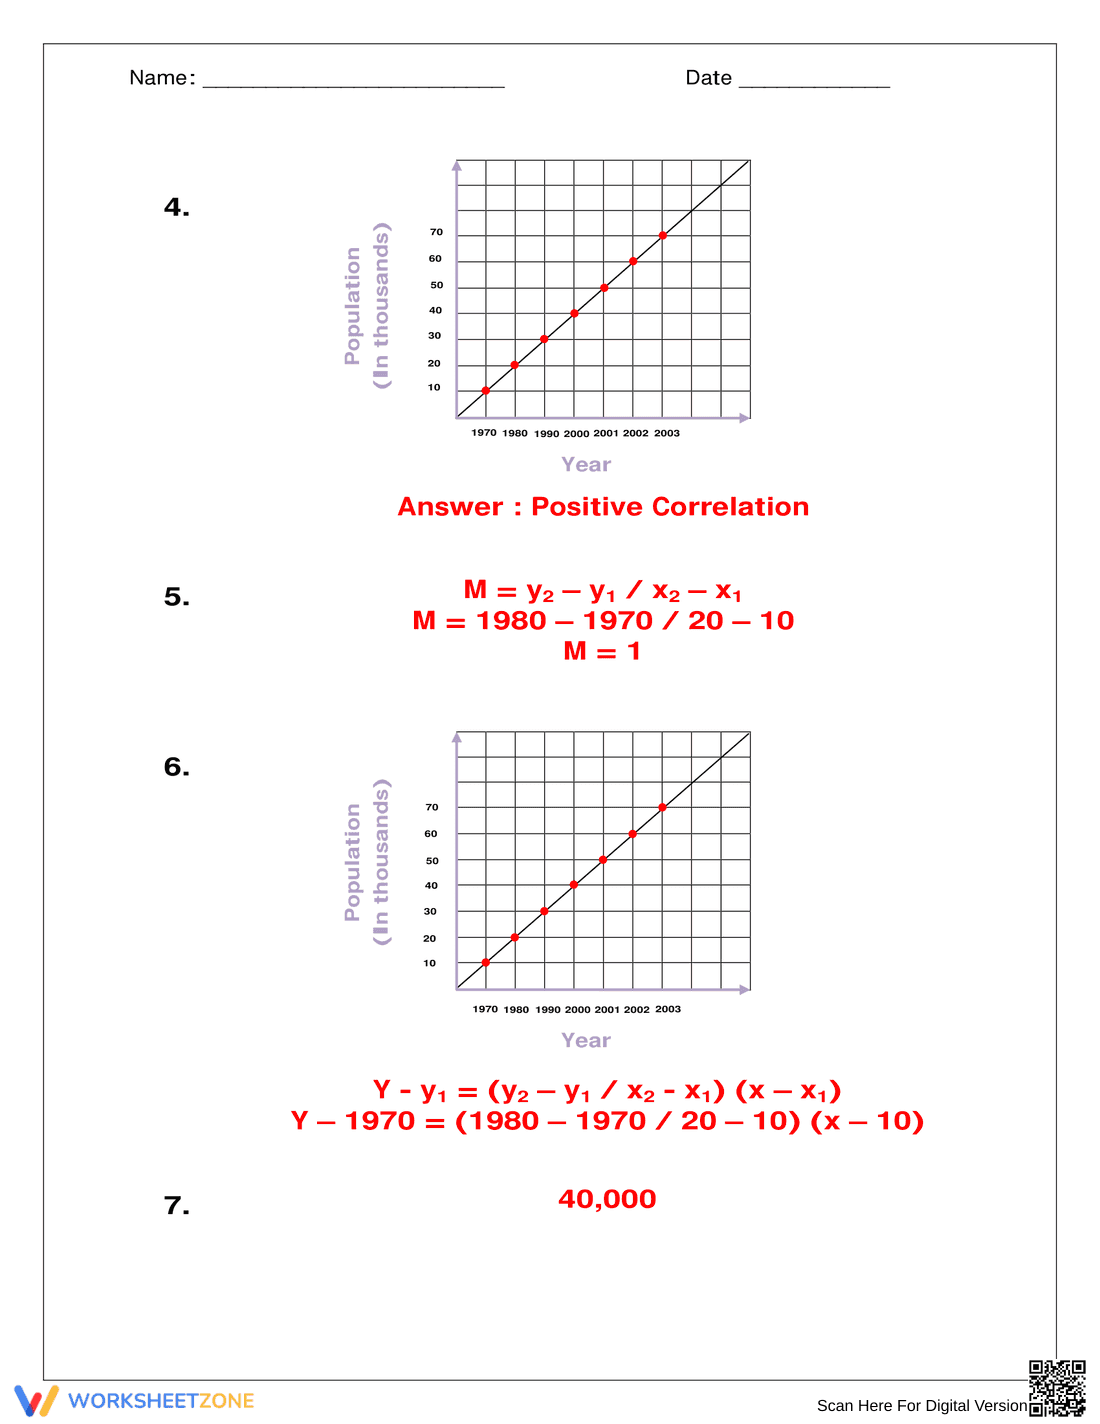
• Draw and analyze the line of best fit
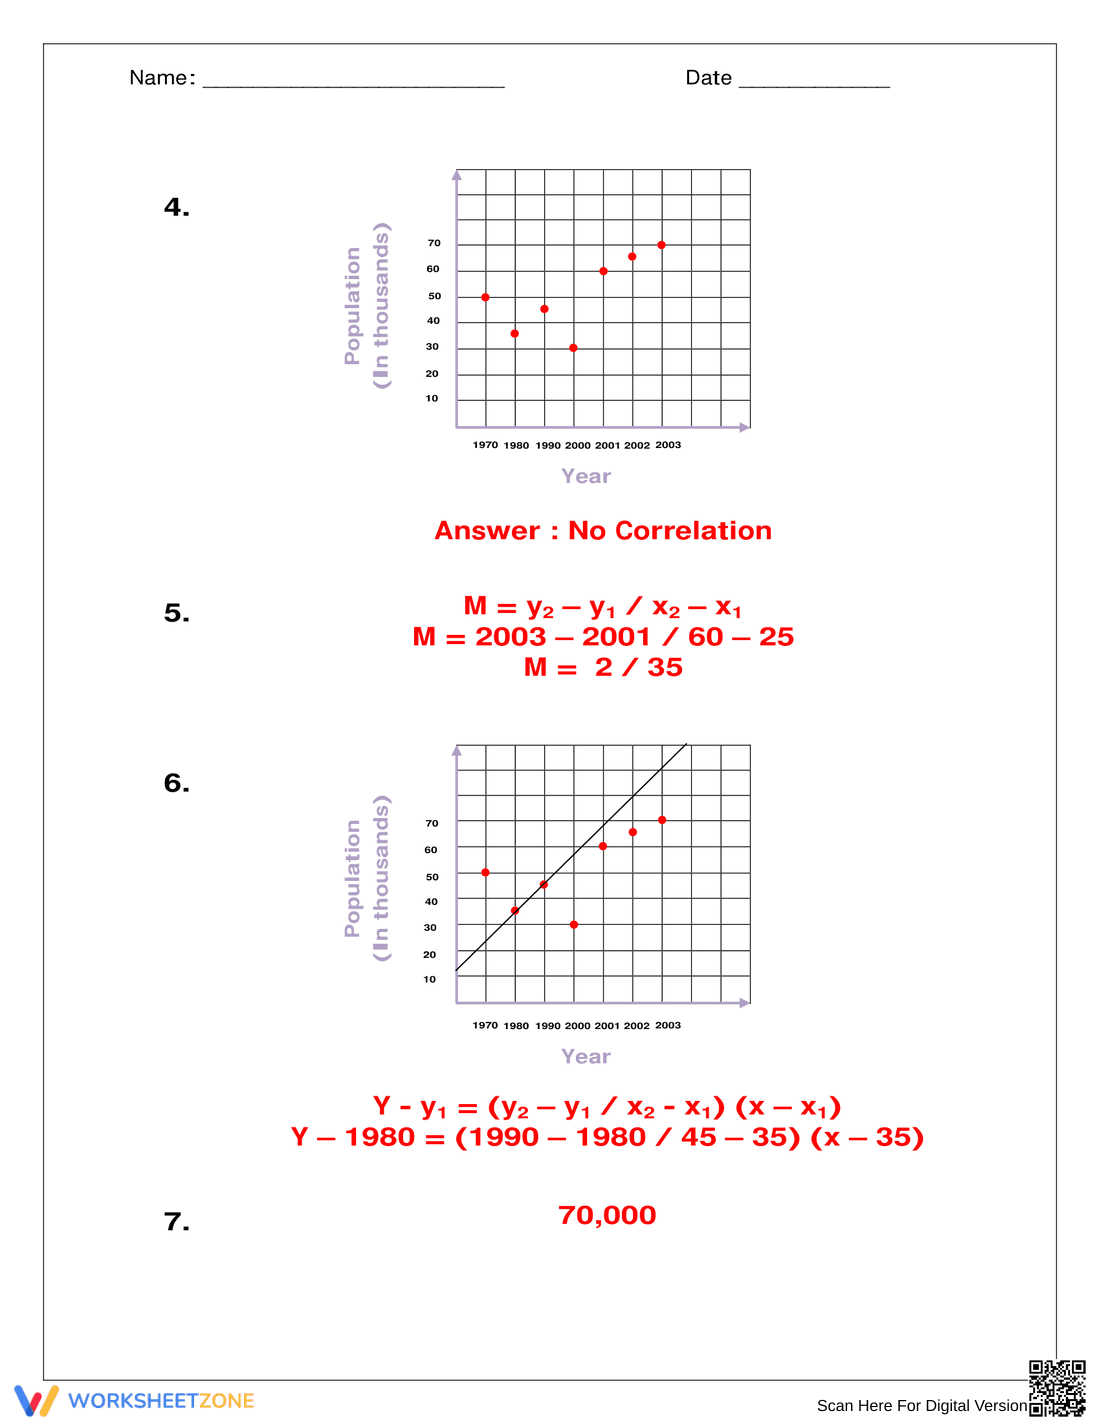
• Calculate slope and write linear equations
• Use graphs to make predictions from data
Grade Suitability:
Best suited for Grades 7–9.
• Middle school students learning scatter plots and trends
• Pre-algebra and early algebra students practicing linear models
Target Users:
Math teachers, middle school and early high school students, and parents supporting graphing and data analysis lessons.
A scatter plots and line of best fit worksheet that guides students through interpreting data tables, sketching scatter plots, analyzing correlation, and writing linear equations.
Why Use It:
This worksheet supports data analysis and algebra readiness by helping students understand correlation, slope, and prediction using real-world contexts such as population growth and distance over time.
How to Use It:
• Identify positive or negative correlation between variables
• Create scatter plots from data tables
• Draw and analyze the line of best fit
• Calculate slope and write linear equations
• Use graphs to make predictions from data
Grade Suitability:
Best suited for Grades 7–9.
• Middle school students learning scatter plots and trends
• Pre-algebra and early algebra students practicing linear models
Target Users:
Math teachers, middle school and early high school students, and parents supporting graphing and data analysis lessons.