


Views
Downloads
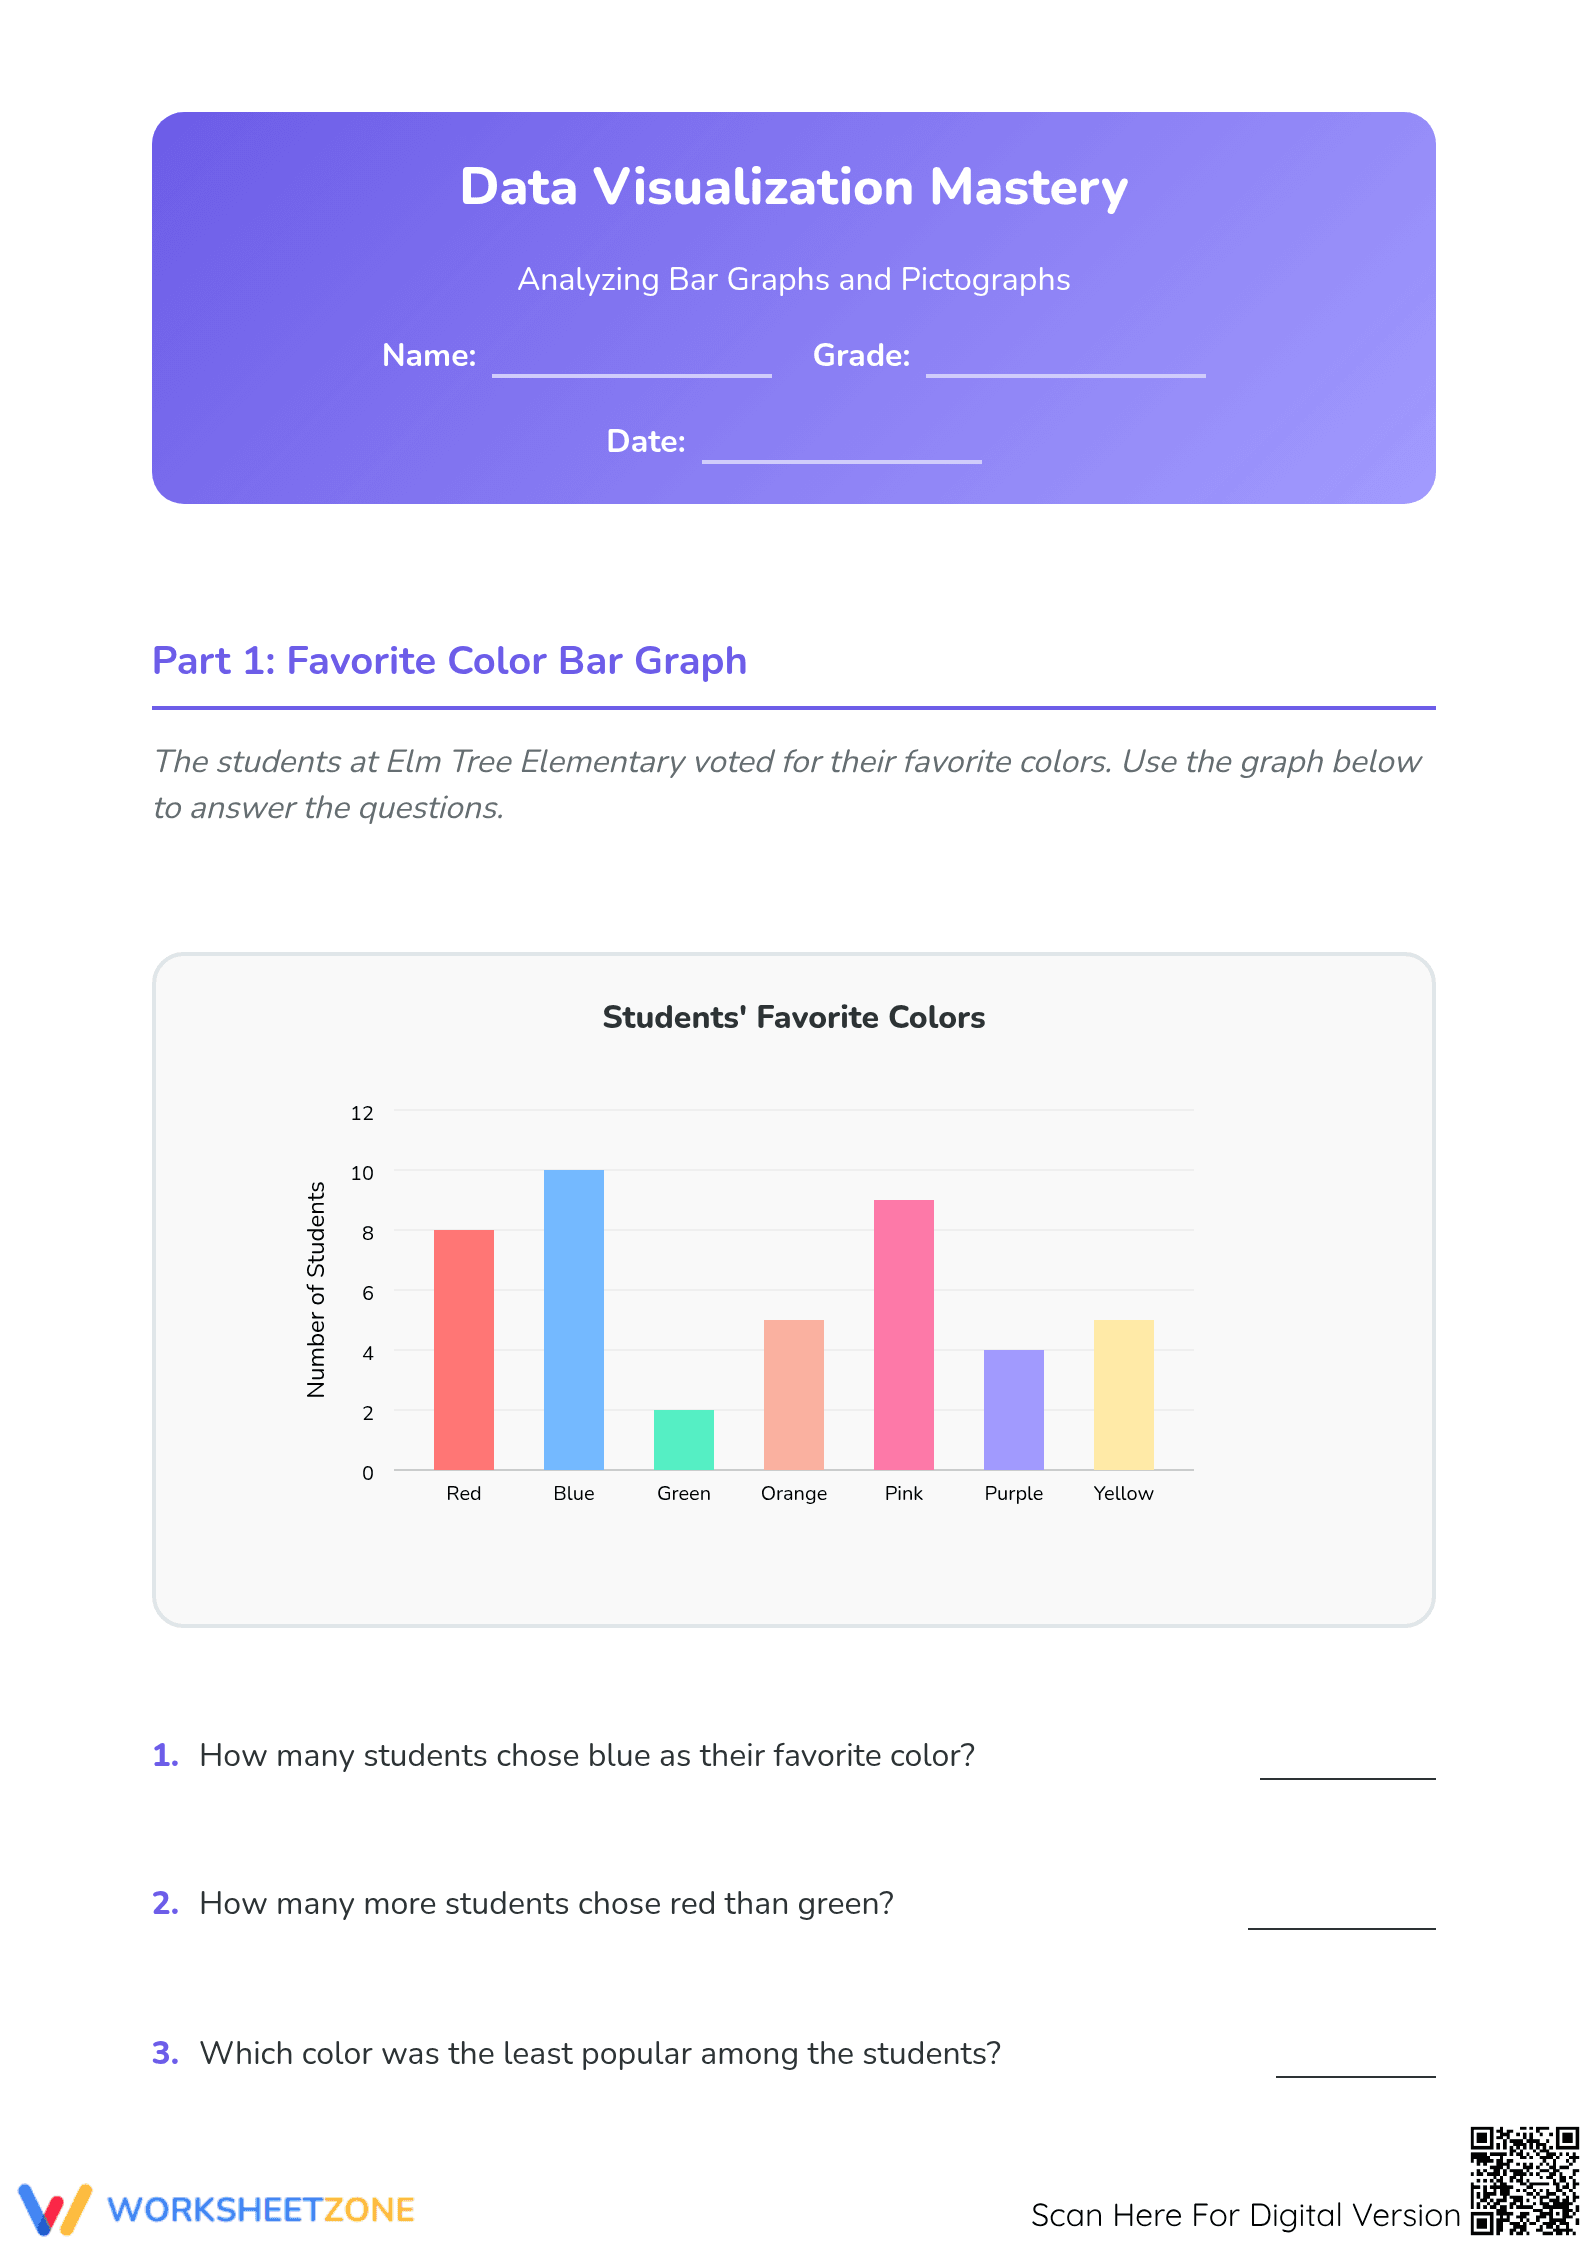


Bar and Pictograph Analysis | Essential Grade 5 Worksheet
Paste this activity's link or code into your existing LMS (Google Classroom, Canvas, Teams, Schoology, Moodle, etc.).
Students can open and work on the activity right away, with no student login required.
You'll still be able to track student progress and results from your teacher account.
This comprehensive data visualization worksheet empowers students to master the interpretation of various graph formats. By analyzing single bar graphs, double bar graphs, and pictographs with scaled keys, learners develop the critical thinking skills necessary to extract meaningful insights from complex data sets. Students will move beyond simple identification to perform multi-step comparisons and calculations based on visual evidence.
At a Glance
- Grade: 5 · Subject: Math
- Standard:
CCSS.MATH.CONTENT.5.MD.B.2— Interpret scaled bar graphs and pictographs to solve multi-step comparison problems- Skill Focus: Multi-format graph analysis
- Format: 4 pages · 18 problems · Answer key included · PDF
- Best For: Independent practice or summative assessment
- Time: 30–45 minutes
What's Inside
The resource consists of four distinct sections across four printable pages. It features 18 targeted problems that challenge students to read axes, calculate totals, and compare data points. The inclusion of a double bar graph introduces comparative analysis between two groups, while the pictographs use scales of 2 and 5 to reinforce multiplication and division within a data context. Each page focuses on a unique scenario, ensuring high student engagement.
Skill Progression
- Guided practice: The initial section provides a single-category bar graph with clear axis labels to build confidence in retrieving specific data points.
- Supported practice: Pictograph tasks require students to apply mental math strategies to determine symbolic values using a key before answering interpretive questions.
- Independent practice: The final sections feature complex double bar graphs and large-scale pictographs that demand synthesis of information from multiple data series.
This gradual-release model ensures students move from basic data retrieval to higher-order synthesis and analysis.
Standards Alignment
CCSS.MATH.CONTENT.5.MD.B.2 — Represent and interpret data. This worksheet provides rigorous practice in solving problems using information presented in various graphical formats, including scaled picture graphs and bar graphs. Both standard codes can be copied directly into lesson plans, IEP goals, or district curriculum mapping tools to ensure instructional compliance.
How to Use It
Use this worksheet as a summative assessment after a unit on data representation or as a structured rotation during math centers. Teachers should observe whether students correctly identify the key in the pictograph sections before performing calculations, as this is a common point of error. The resource is also ideal for small-group remediation. Expected completion time ranges from 30 to 45 minutes.
Who It's For
This resource is designed for fifth-grade students mastering data analysis, but it serves as excellent enrichment for fourth grade or remediation for middle school. It pairs naturally with a lesson on independent and dependent variables or a science unit involving experimental data collection. The clear layout supports students who benefit from structured visual organizers.
Data interpretation is a foundational numeracy skill that bridges the gap between basic arithmetic and statistical reasoning. This worksheet aligns with CCSS.MATH.CONTENT.5.MD.B.2, focusing on the plain-English skill of interpreting scaled bar graphs and pictographs to solve multi-step comparison problems. According to Fisher & Frey (2014), the use of diverse graphical representations within a single instructional session supports the development of flexible mathematical thinking and improves the transfer of data literacy skills to real-world contexts. By challenging students to navigate single-category, dual-category, and symbolic data displays, this resource ensures that learners are not just memorizing procedures but are actively engaging in the cognitive work of data synthesis. The inclusion of 18 specific tasks provides the volume of practice required for students to reach fluency in identifying trends and anomalies within visual data sets, a core competency highlighted in recent NAEP assessment frameworks.