


Views
Downloads

Organizing and Understanding Data | Essential Grade 1 Math
Paste this activity's link or code into your existing LMS (Google Classroom, Canvas, Teams, Schoology, Moodle, etc.).
Students can open and work on the activity right away, with no student login required.
You'll still be able to track student progress and results from your teacher account.
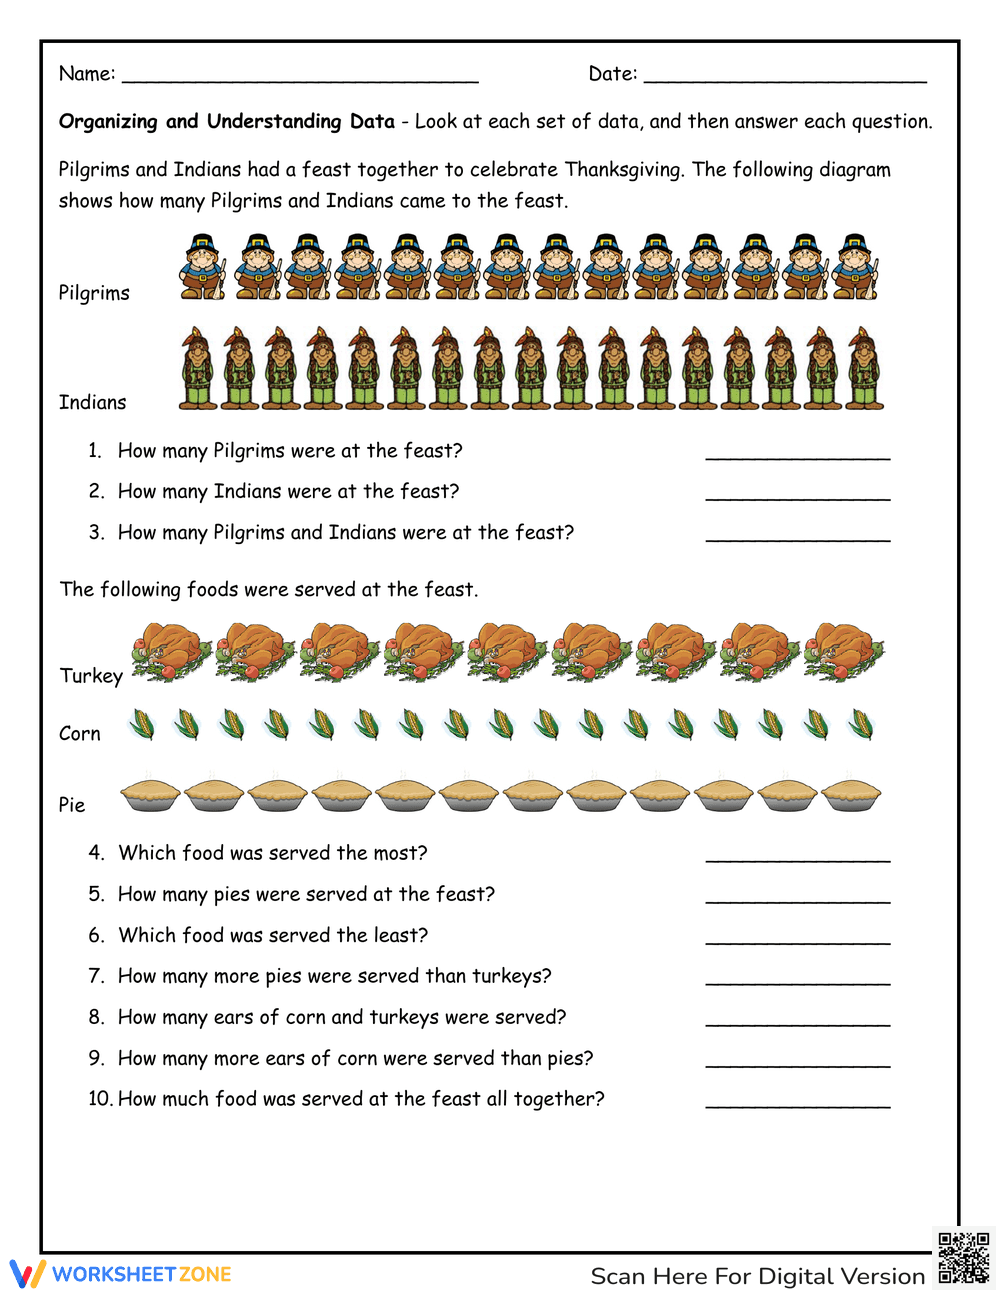
This Grade 1 math worksheet helps students master data interpretation through a festive Thanksgiving theme. By analyzing visual diagrams of feast participants and food items, learners practice counting, comparing quantities, and performing basic addition. It provides a clear path for students to translate visual information into numerical answers and logical conclusions.
At a Glance
- Grade: 1 · Subject: Math
- Standard:
CCSS.MATH.CONTENT.1.MD.C.4— Organize, represent, and interpret data with up to three categories- Skill Focus: Data analysis and comparison
- Format: 1 page · 10 problems · Answer key included · PDF
- Best For: Independent practice or holiday math centers
- Time: 15–20 minutes
What's Inside: This resource features a single-page layout with two distinct data sets. The first set focuses on people (Pilgrims and Indians), while the second set categorizes three types of food (Turkey, Corn, and Pie). Students encounter 10 specific questions ranging from simple counting to complex "how many more" comparisons. A full-color answer key is provided for rapid grading.
Zero-Prep Workflow: This worksheet is designed for immediate classroom implementation. First, print the single-page PDF (30 seconds). Next, distribute the sheets to students for a focused math block or morning work session (1 minute). Finally, use the included answer key to review results or allow students to self-correct their work (1 minute). Total teacher preparation time is under 3 minutes.
Standards Alignment: The primary focus is `CCSS.MATH.CONTENT.1.MD.C.4`, which requires students to organize, represent, and interpret data with up to three categories. It also supports basic addition and subtraction skills within 100. Both standard codes can be copied directly into lesson plans, IEP goals, or district curriculum mapping tools.
How to Use It: Use this worksheet during a guided math rotation to assess student understanding of comparative language like "most," "least," and "how many more." It also serves as an excellent formative assessment at the end of a data unit. Observe if students are using one-to-one correspondence while counting the icons or if they are grouping them for efficiency.
Who It's For: This resource is tailored for first-grade students but remains highly effective for second-grade review or kindergarten enrichment. It is particularly useful for English Language Learners (ELLs) due to the heavy visual support. Pair this with a physical sorting activity using manipulatives or a Thanksgiving-themed anchor chart for maximum impact.
According to the RAND AIRS 2024 report, high-quality visual representations in early elementary mathematics significantly reduce cognitive load, allowing students to focus on higher-order comparison skills rather than just rote counting. This worksheet aligns with those findings by using clear, thematic icons to represent data points for CCSS.MATH.CONTENT.1.MD.C.4. By requiring students to answer questions about the total number of data points and the difference between categories, the resource reinforces the "interpret" phase of data literacy. Research from Fisher & Frey (2014) emphasizes that scaffolded data tasks help bridge the gap between concrete counting and abstract numerical reasoning. This 10-task set provides the necessary repetition for students to achieve mastery in organizing and understanding data within a familiar cultural context. Educators can confidently integrate this tool into evidence-based instructional frameworks to support data-driven decision-making in the classroom.