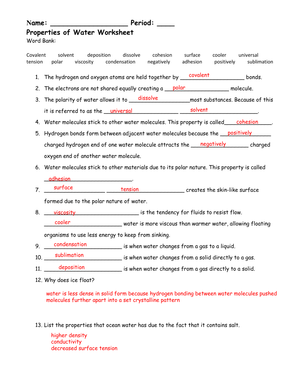
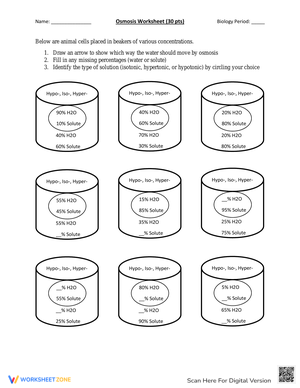
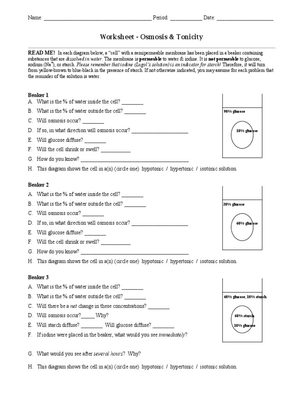
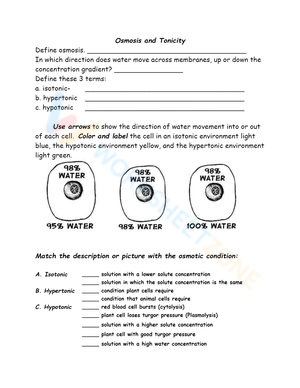
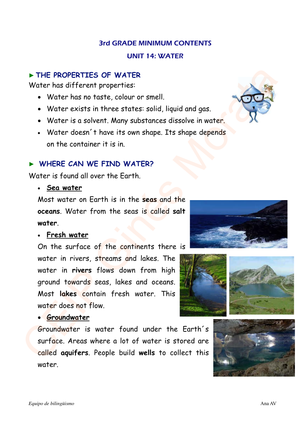
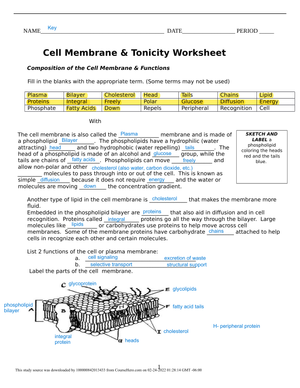
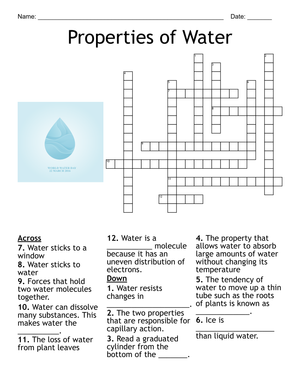
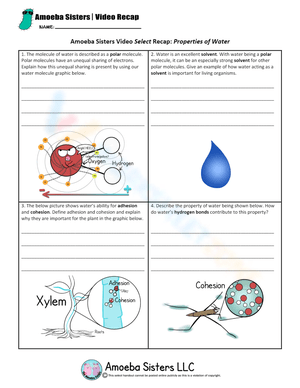
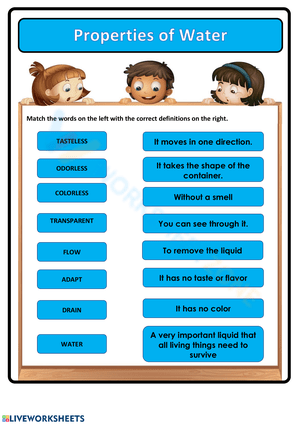
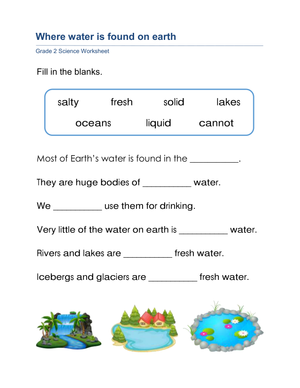
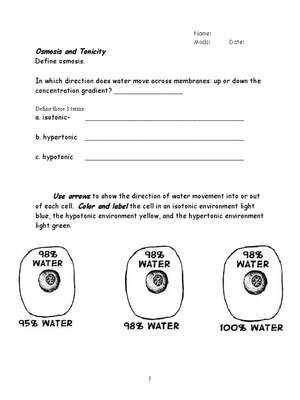
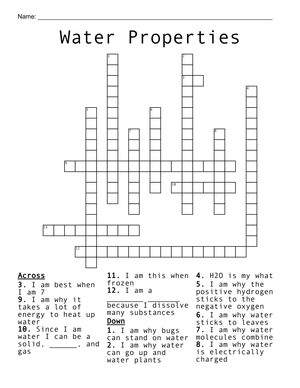
10th grade water printable worksheets give science teachers a direct way to address one of the most cross-cutting topics on the course map — a subject that surfaces in environmental science, earth science, and biology units without ever fully belonging to just one of them. Each worksheet in this set targets a specific skill or concept, from tracing the water cycle to analyzing contamination data, so teachers can pull individual resources for a warm-up, a guided lesson, or end-of-unit review without sorting through a larger packet.
What Each Worksheet Covers
The set moves through water as a physical system before turning to water as a resource under pressure. That sequence matters at this grade level, because 10th graders are developmentally ready to connect natural processes to policy and land-use decisions — something 6th-grade water lessons typically can't sustain without losing the thread. Each worksheet stays focused on one concept, which keeps cognitive load manageable during independent work.
- Water cycle mechanics: evaporation, condensation, precipitation, surface runoff, infiltration, and groundwater recharge — students label diagrams and complete process sequences
- Watersheds and drainage basins: how topography routes water toward collection points, and what enters those systems from surrounding land
- Freshwater distribution: Earth's water budget, limits on accessible freshwater, and why most of the planet's fresh supply is locked in ice or underground
- Water quality indicators: pH, turbidity, dissolved oxygen, and nitrates — and what shifts in those values signal about a water system's health
- Pollution sources: distinguishing point-source from nonpoint-source contamination, with examples drawn from agriculture, stormwater, and industrial discharge
- Drinking water treatment: the stages communities use to protect potable water, and where those systems fail in underserved areas
- Conservation and water management: household, agricultural, and municipal strategies, with data comparing water use by sector
Several worksheets pair a short nonfiction passage with graph or table analysis so students practice scientific reading and data interpretation in the same exercise. That combination reflects how water issues appear on standardized science assessments and in authentic environmental reporting.
The Wrong Turns Students Take on These Topics
The water cycle is one of those topics students believe they already know, which creates a specific problem: they recall terms from middle school but can't apply them correctly in a new context. The most predictable error is students who accurately label "evaporation" on a diagram but then write that groundwater "evaporates into the soil" when asked to explain recharge. They've memorized a word without internalizing directionality. Any worksheet that asks students to explain a process step in their own words — rather than just label it — surfaces that gap before a unit test does.
Watershed diagrams produce a second consistent mistake. Students draw runoff flowing in whatever direction looks natural on the page instead of following elevation gradients. When a diagram slopes left-to-right, some students will reverse arrows simply because a direction "looked wrong," without reasoning from elevation data at all. Worksheets that include contour lines or elevation figures alongside the watershed drawing give teachers a clear way to address this before it calcifies into a misconception.
On water quality worksheets, students routinely treat any change in a measured value as evidence of contamination. A student who reads that a stream's pH dropped from 7.2 to 6.8 after heavy rain will often write "the water is now contaminated" without checking whether that change falls within a healthy range for the ecosystem. Building the habit of comparing data against a reference range — rather than simply noting the direction of change — is worth addressing explicitly at this stage, before students encounter similar data interpretation tasks on assessments.
Fitting These Worksheets Into Your Weekly Plan
Most worksheets work well in the 20 to 25 minutes of independent practice that follows direct instruction, but a few serve a different function. Vocabulary and concept-check worksheets are most useful on day one of a unit, before students have enough background to interpret a data set meaningfully. Diagram-labeling worksheets work well the next day — students finish them quickly, and the results tell the teacher exactly which process steps are still confused before the lesson moves forward.
Reading and data-analysis worksheets are stronger mid-unit, once students can connect terms to actual systems. A 5-day sequence that holds up in practice: day one for vocabulary and prior knowledge, day two for a water cycle or watershed diagram, day three for a short nonfiction reading on groundwater or pollution, day four for data analysis using water-use or contamination figures, and day five for an application prompt asking students to recommend conservation steps or explain how land use shapes a local watershed. That structure requires no new activity format each day, which matters when there's a full class to manage and limited transition time between tasks.
Teachers also rely on 10th grade water printable worksheets for sub plans. Water topics are substantive enough to fill a full period without video supplements, and most of these worksheets include enough written instruction for students to work independently in the teacher's absence.
Standard Alignment
This set aligns most directly with NGSS HS-ESS3-1, which asks students to construct an evidence-based explanation for how the availability of natural resources — water chief among them — has shaped human activity. In classroom terms, that standard lives in the pollution, treatment, and conservation worksheets, where students move from describing a water system to explaining how access and quality drive decisions. HS-ESS2-5 connects to the worksheets addressing water's role in shaping Earth's surface processes, particularly the watershed and runoff materials. Teachers working in NGSS-aligned states will find these resources slot naturally into an Earth and Human Activity unit or into an Earth's Systems strand when water serves as the anchoring phenomenon for the course.
Making These Worksheets Work Across Ability Levels
The most useful adjustment for students who need additional support is adding a word bank to the diagram and short-answer worksheets. For water topics specifically, the academic vocabulary — aquifer, infiltration, turbidity, potable, nonpoint-source — is unfamiliar enough that students without a word bank spend their cognitive effort searching for terms rather than using them to reason. Providing the vocabulary list doesn't remove the challenge; it redirects attention toward the actual thinking the worksheet targets.
Students ready for deeper work can extend the data worksheets in one practical way: instead of answering only the printed questions, ask them to write two additional questions the data set could answer, then answer one of them with evidence. That extension works especially well with water-use comparison graphs, where the figures support multiple lines of analysis. For the application prompts, advanced students can justify recommendations by citing specific figures from earlier worksheets in the unit rather than writing general explanations. 10th grade water printable worksheets at this level of challenge give those students a genuine analytical task rather than just more volume.
Frequently Asked Questions
Can these worksheets work in both environmental science and earth science courses?
Yes. Water connects physical, ecological, and human systems, so the core content — watershed diagrams, water quality analysis, conservation data — fits either course structure. Environmental science teachers tend to lean more heavily on the pollution and treatment worksheets, while earth science teachers use the water cycle and groundwater materials most. The resources adapt to both without modification.
How long does each worksheet take to complete?
Most worksheets run 15 to 25 minutes for on-grade-level students working independently. Nonfiction reading worksheets take closer to 30 minutes when students write full responses. Diagram-labeling worksheets are shorter — usually 10 to 15 minutes — and work well as warm-ups or exit checks rather than full lesson activities.
Are these resources appropriate for students who already covered the water cycle in middle school?
These 10th grade water printable worksheets go well beyond the cycle diagram most students encountered in 6th or 7th grade. The middle school version of this topic typically stops at labeling evaporation and precipitation. These worksheets add groundwater movement, human-impact analysis, water quality data interpretation, and policy-level questions about conservation and access — none of which appear in most middle school water units. Students will recognize some of the vocabulary, but the tasks are substantively different.
What if students struggle with the data analysis worksheets?
Start by having students read the graph title and axis labels aloud before answering any question — this one step catches the majority of misreading errors. Then direct them to identify one specific number from the data before writing anything else. Students who try to interpret a whole graph at once tend to produce vague generalities; students who begin with a single data point write sharper, more accurate responses. If these are a student's first data worksheets in the course, pair the first one with a brief whole-class walk-through before sending students to work independently.












 Interactive Worksheet Maker
 Quiz Maker
 Word Search Maker
 Crossword Puzzle Maker
 Word Scramble Generator
 Sentence Scramble Generator
 Handwriting Worksheet Generator
 Name Tracing Generator
 Fill In The Blank Generator