


0
Views
0
Downloads
0.0
0
Save
0 Likes
Cut Out Graph Chairs
0 Views
0 Downloads
Paste this activity's link or code into your existing LMS (Google Classroom, Canvas, Teams, Schoology, Moodle, etc.).
Students can open and work on the activity right away, with no student login required.
You'll still be able to track student progress and results from your teacher account.
Information
Description
What It Is:
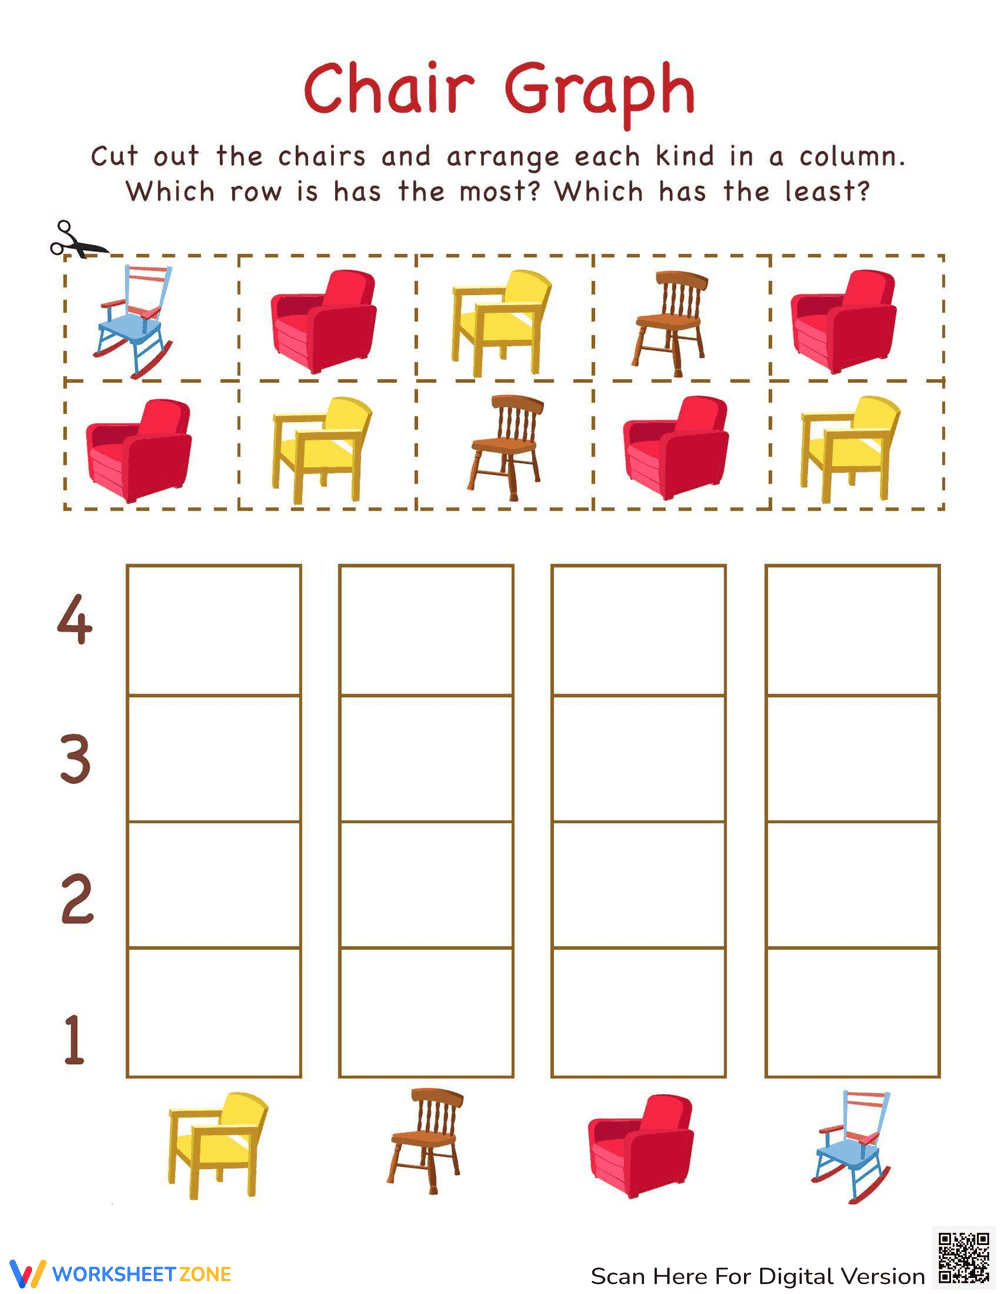
This is a printable worksheet titled 'Chair Graph'. The worksheet contains a set of chair images of different styles arranged in a grid. Below the grid, there is a blank bar graph with the numbers 1 through 4 on the Y-axis. The instruction asks the student to cut out the chairs and arrange each kind in a column to create a graph. The student is then asked to identify which row has the most and the least.
Grade Level Suitability:
This worksheet is suitable for Kindergarten and Grade 1. It involves basic counting, sorting, and graphing skills, which are typically introduced in these grades. The cutting activity also helps with fine motor skills.
Why Use It:
This worksheet helps students develop skills in data representation, graphing, and basic comparison (most vs. least). It also reinforces counting skills and fine motor skills through the cutting activity. It visually demonstrates how to organize data into a simple bar graph.
How to Use It:
First, have the student cut out the individual chair images from the grid. Then, instruct them to sort the chairs by type and paste them into the corresponding columns of the bar graph. Finally, ask the student to analyze the completed graph to determine which chair type appears most and least frequently.
Target Users:
This worksheet is designed for young children in Kindergarten or Grade 1 who are learning about graphing, data analysis, and counting. It's also beneficial for students who need to practice their fine motor skills.