


0
Views
0
Downloads
0.0
0
Save
0 Likes
Tally Ho! Food Themed Worksheet
0 Views
0 Downloads
Paste this activity's link or code into your existing LMS (Google Classroom, Canvas, Teams, Schoology, Moodle, etc.).
Students can open and work on the activity right away, with no student login required.
You'll still be able to track student progress and results from your teacher account.
Information
Description
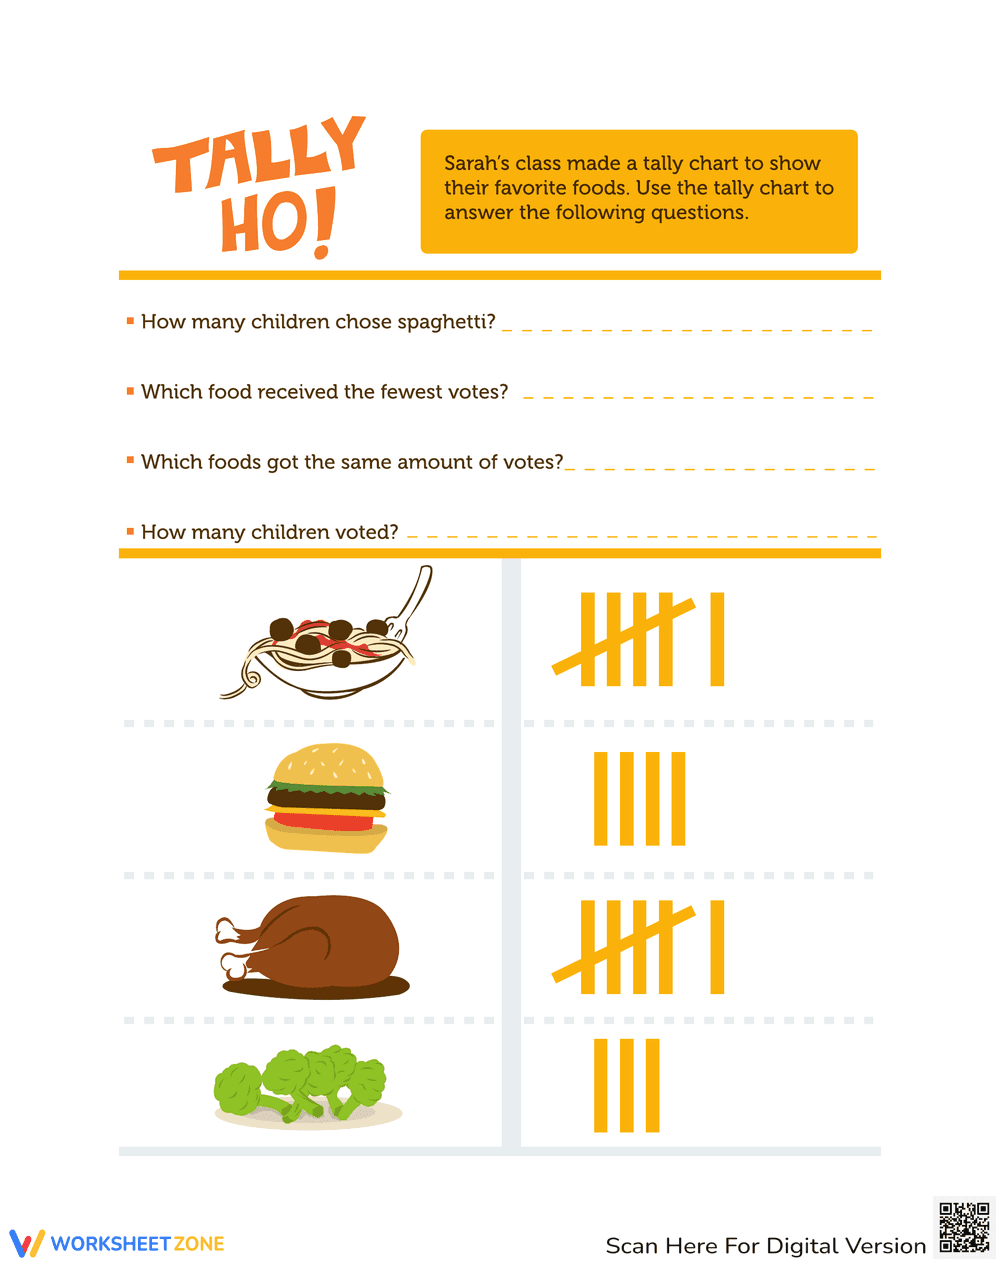
What It Is:
This is a math worksheet focusing on tally charts. It presents a tally chart showing children's favorite foods: spaghetti, burger, roast chicken, and broccoli. Students are asked to answer questions based on the provided tally marks, such as 'How many children chose spaghetti?', 'Which food received the fewest votes?', 'Which foods got the same amount of votes?', and 'How many children voted?'.
Grade Level Suitability:
This worksheet is suitable for 1st and 2nd grade. It involves basic counting and interpreting tally marks, which are foundational skills taught in these grades. The questions are simple and directly related to the data presented.
Why Use It:
This worksheet helps students develop data interpretation skills and practice reading tally charts. It reinforces counting skills and introduces the concept of data representation in a visual format. It also encourages critical thinking as students analyze the data to answer the questions.
How to Use It:
Students should first examine the tally chart and understand the value represented by each tally mark. Then, they should count the tally marks for each food item and use that information to answer the questions provided. They can write their answers on the lines provided.
Target Users:
This worksheet is ideal for elementary school students in 1st and 2nd grade learning about data representation, tally charts, and basic counting skills. It can also be used for students who need extra practice with data interpretation.