






























Proven Genotype & Phenotype Worksheet | Grades 8-12 Science

Paste this activity's link or code into your existing LMS (Google Classroom, Canvas, Teams, Schoology, Moodle, etc.).
Students can open and work on the activity right away, with no student login required.
You'll still be able to track student progress and results from your teacher account.
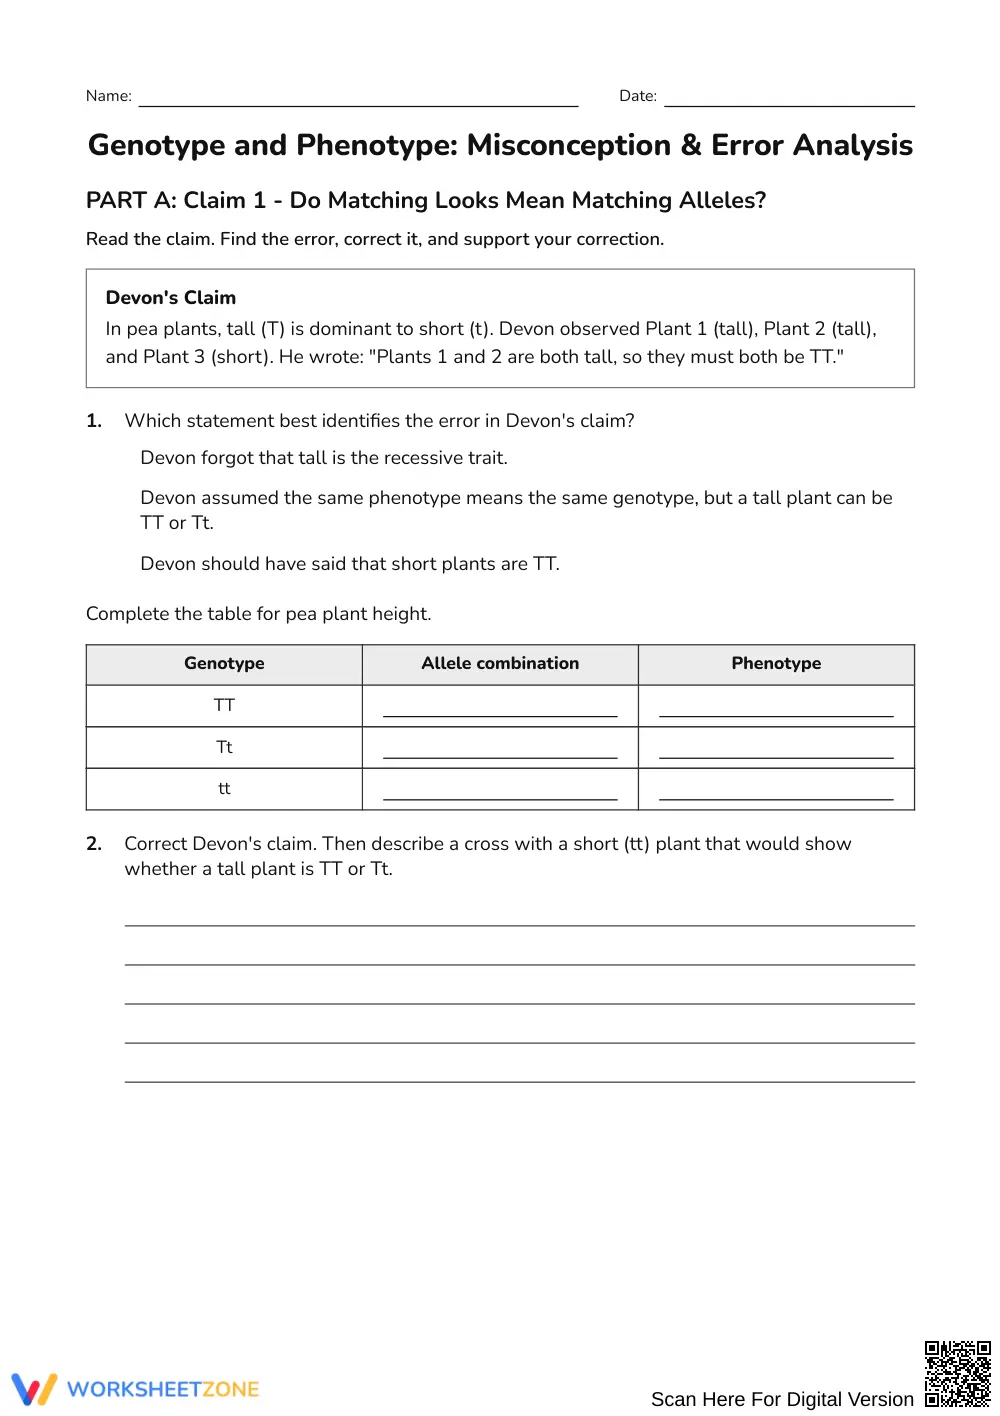
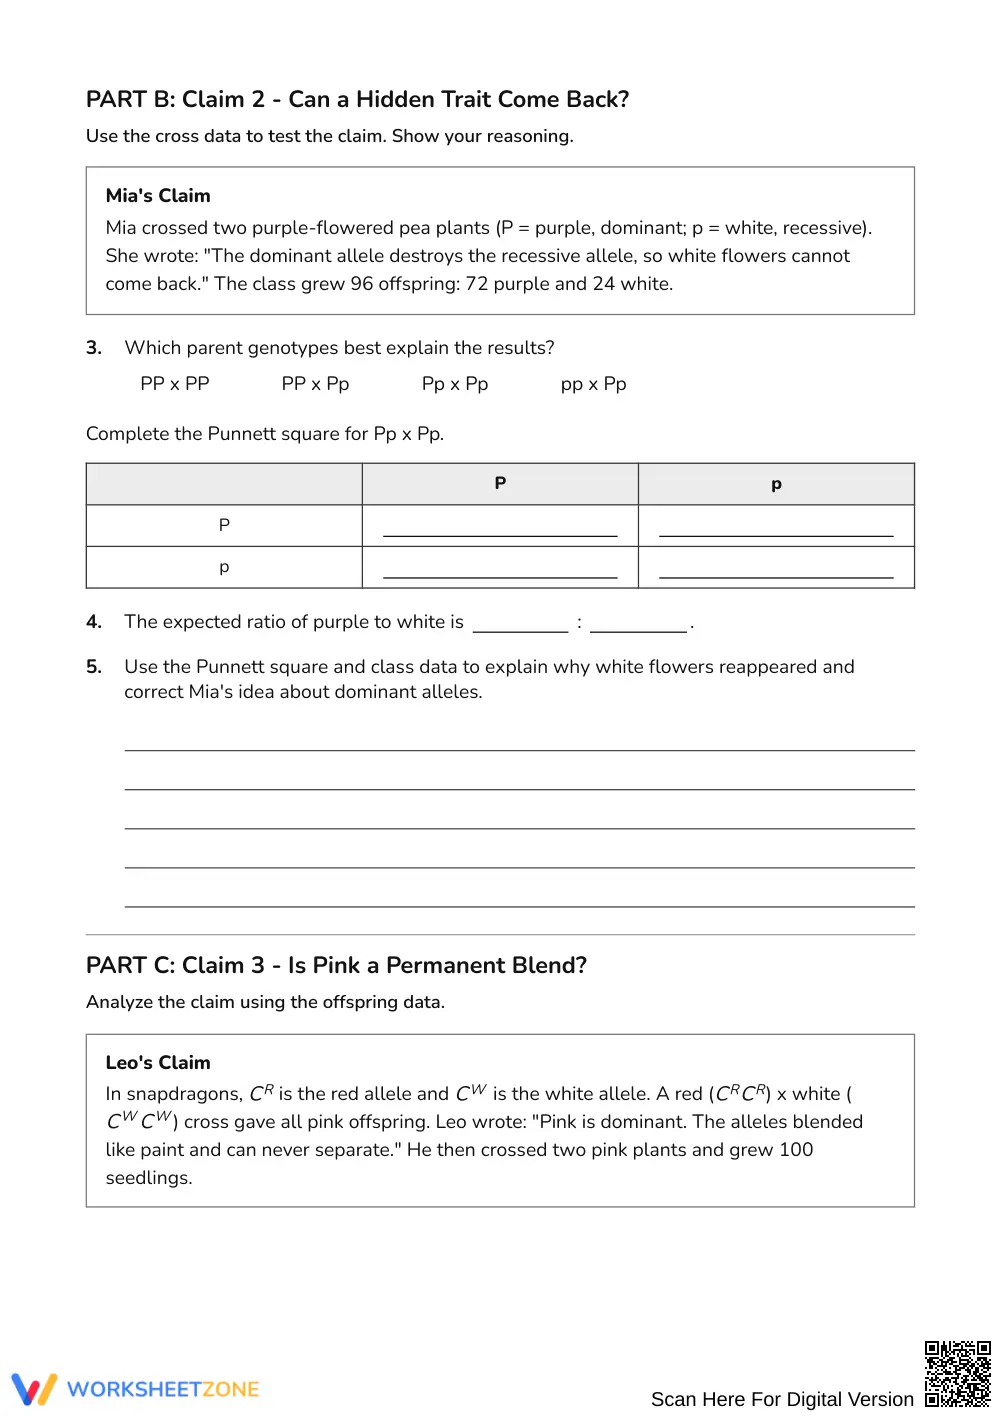
This comprehensive genetics practice activity targets common student misconceptions surrounding alleles, inheritance patterns, and the relationship between genotype and phenotype. Students analyze four authentic student claims, identify scientific reasoning errors, complete Punnett squares, and construct evidence-based scientific explanations to solidify core genetics concepts.
At a Glance
- Grade: Grades 8–12 · Subject: Science
- Standard: Differentiate genotype from phenotype and predict trait inheritance using genetic models
- Skill Focus: Misconception & Error Analysis
- Format: 4 pages · 32 problems · Answer key included · PDF
- Best For: Genetics error analysis and mastery review
- Time: 45–60 minutes
What's Inside
This four-page resource provides 32 structured questions organized into four thematic parts. Students evaluate flawed peer claims regarding complete dominance, allele masking versus destruction, incomplete dominance in snapdragons, and codominance in ABO blood types. Tasks feature error identification multiple-choice questions, data tables, Punnett squares, test cross evaluations, and open-response mechanistic explanations supported by a complete four-page answer key.
Skill Progression
- Guided practice (Part A, 7 tasks): Students critique Devon's claim regarding identical phenotypes, complete a pea plant genotype-phenotype reference table, and explain test crosses.
- Supported practice (Parts B & C, 15 tasks): Learners analyze numerical offspring data, disprove claims of allele blending or destruction, and construct Punnett squares calculating expected ratios.
- Independent practice (Part D, 10 tasks): Students distinguish codominance from incomplete dominance, predict non-Mendelian blood type outcomes, and synthesize how alleles produce traits via protein synthesis.
This structured sequence applies the gradual-release model (I Do, We Do, You Do) to move students from basic error detection to independent mechanistic reasoning.
Standards Alignment
This resource aligns with secondary life science standards requiring students to develop models showing how gene combinations produce observable traits and explain inheritance patterns across generations. Both standard codes can be copied directly into lesson plans, IEP goals, or district curriculum mapping tools.
How to Use It
Deploy this worksheet after direct instruction on Mendelian genetics and Punnett squares as a mid-unit checkpoint. During student independent work, circulate to observe Part B and verify that learners recognize dominant alleles mask rather than destroy recessive alleles. Alternatively, assign individual sections as targeted station rotations or warm-ups across a four-day genetics sequence. Expected completion time is 45 to 60 minutes.
Who It's For
This activity is designed for middle and high school life science and biology classrooms, including general biology, honors courses, and remedial intervention groups. Pair this worksheet directly with a monohybrid cross anchor chart or hands-on allele modeling kit to support multi-modal learning.
Diagnostic misconception analysis in genetics directly reinforces conceptual understanding by requiring students to confront and correct flawed reasoning. According to Fisher & Frey (2014), structured error analysis provides essential cognitive friction, shifting students from rote algorithmic Punnett square execution to authentic conceptual mastery. By evaluating claims regarding allele dominance, blending, and phenotypic expression across 32 tasks, secondary science students bridge the critical gap between molecular instructions and physical traits. The inclusion of multi-step items—such as distinguishing codominance from incomplete dominance in blood types—cultivates deep reasoning rather than superficial memorization. The four-page answer key supports rapid teacher feedback and targeted intervention during formative assessment cycles. As empirical findings from Fisher & Frey demonstrate, guided critique paired with corrective modeling produces measurable gains in scientific literacy and retention, helping students successfully internalize foundational inheritance principles across diverse secondary science classrooms.


