





















Printable Seismic Records Worksheet | Grade 8 Science
Paste this activity's link or code into your existing LMS (Google Classroom, Canvas, Teams, Schoology, Moodle, etc.).
Students can open and work on the activity right away, with no student login required.
You'll still be able to track student progress and results from your teacher account.
This Grade 8 Science worksheet builds students' ability to read, calculate, and evaluate seismic arrival data from a four-station network. Across 10 structured tasks, students move from extracting values directly from data tables to computing epicenter distances, identifying fault sources, and assessing the real-world limitations of the S–P interval method.
At a Glance
- Grade: 8 · Subject: Science
- Standard: Earthquakes & Seismic Activity — Read seismic records and use S–P intervals to locate earthquake epicenters
- Skill Focus: Interpreting seismic records from multiple stations
- Format: 5 pages · 10 problems · Answer key included · PDF
- Best For: Guided practice after seismic wave direct instruction
- Time: 35–50 minutes
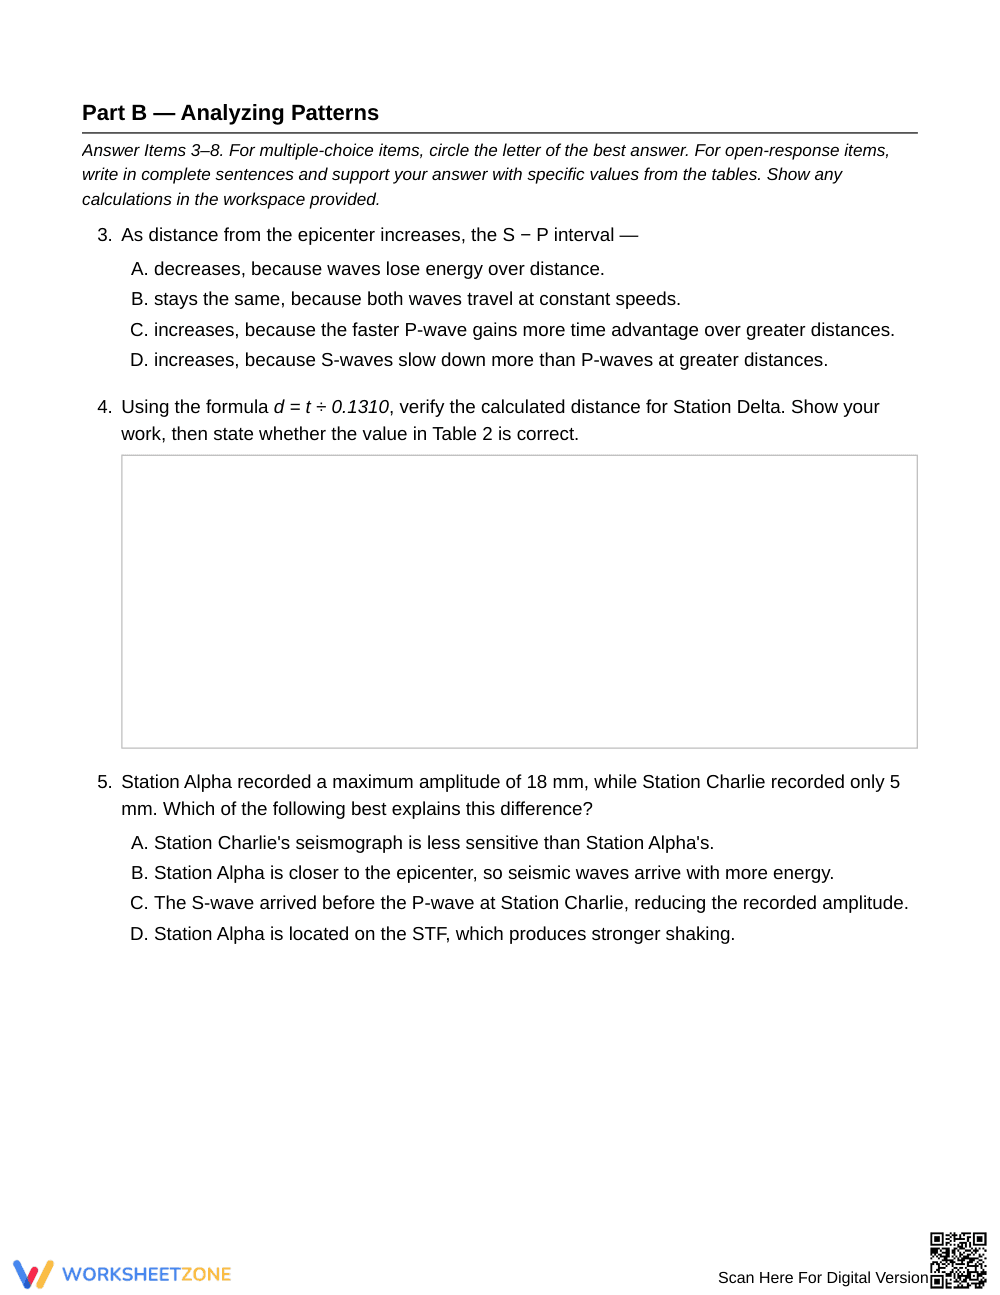
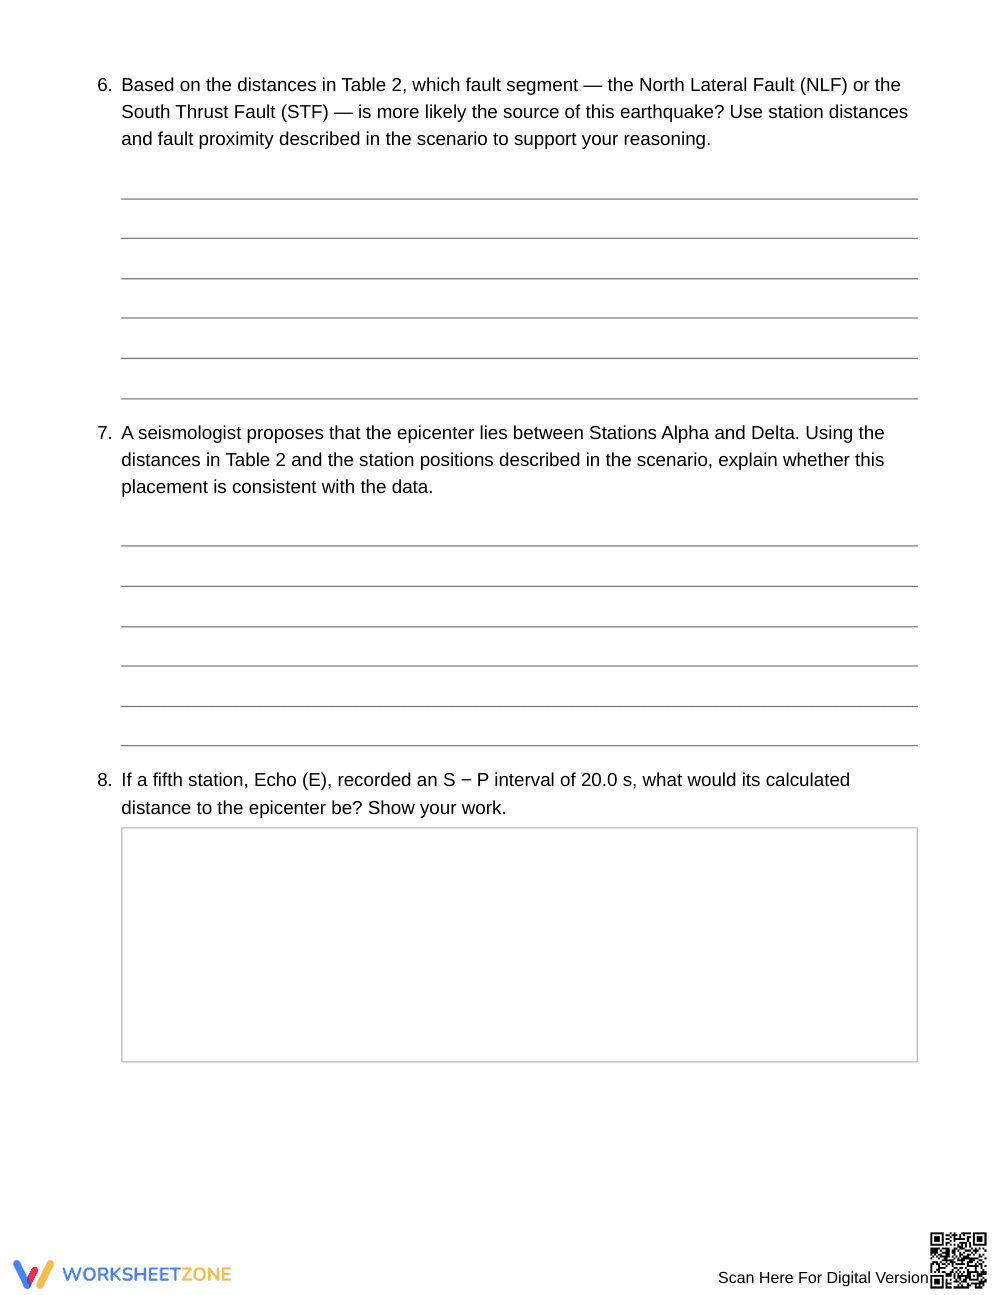
The worksheet spans 5 pages organized into three distinct parts. Part A (Items 1–2) asks students to read values directly from synthetic data tables showing arrival times and calculated distances. Part B (Items 3–8) combines multiple-choice and open-response tasks requiring formula application, pattern analysis, and evidence-based reasoning. Part C (Items 9–10) prompts extended written responses evaluating network limitations and model assumptions. A complete answer key covers all 10 items.
- Guided practice (Items 1–2): Students locate specific values in Tables 1 and 2, building confidence with the data format before any analysis begins.
- Supported practice (Items 3–7): Five tasks scaffold the transition to quantitative reasoning as students apply the formula d = t ÷ 0.1310, explain amplitude differences, and construct written arguments about fault sources.
- Independent practice (Items 8–10): Students calculate epicenter distances from scratch and compose analytical paragraphs evaluating triangulation limitations with minimal scaffolding.
Use Part A as an introductory warm-up before assigning Parts B and C after direct instruction on the S–P interval formula and epicenter triangulation. Circulate during Item 6 to check whether students cite both station distances and fault proximity, a reliable indicator of conceptual understanding. Designed for Grade 8 Earth Science courses, this resource works effectively for whole-class instruction, collaborative partner work, or independent practice.
This worksheet targets the Grade 8 Earth Science skill of interpreting seismic records from multiple stations to determine epicenter location — a foundational competency in understanding earthquake hazards. Research consistently supports structured data-analysis tasks as a mechanism for building scientific reasoning: Fisher & Frey (2014) identify gradual-release frameworks as among the highest-leverage instructional designs for content-area literacy, and this worksheet's three-part progression directly reflects that model. Students who can calculate epicenter distances, evaluate amplitude patterns, and articulate the limitations of constant-speed assumptions demonstrate the kind of evidence-based reasoning emphasized in rigorous middle school science curricula. By analyzing synthetic arrival times and cross-referencing fault lines, learners strengthen their quantitative skills while developing core analytical habits. The 10-task structure, complete answer key, and clear data tables make this resource immediately usable for direct classroom instruction, formative assessment, or earthquake-unit review without requiring additional teacher preparation.


