






























Printable Genotype vs Phenotype Worksheet | Grade 9 Biology

Paste this activity's link or code into your existing LMS (Google Classroom, Canvas, Teams, Schoology, Moodle, etc.).
Students can open and work on the activity right away, with no student login required.
You'll still be able to track student progress and results from your teacher account.
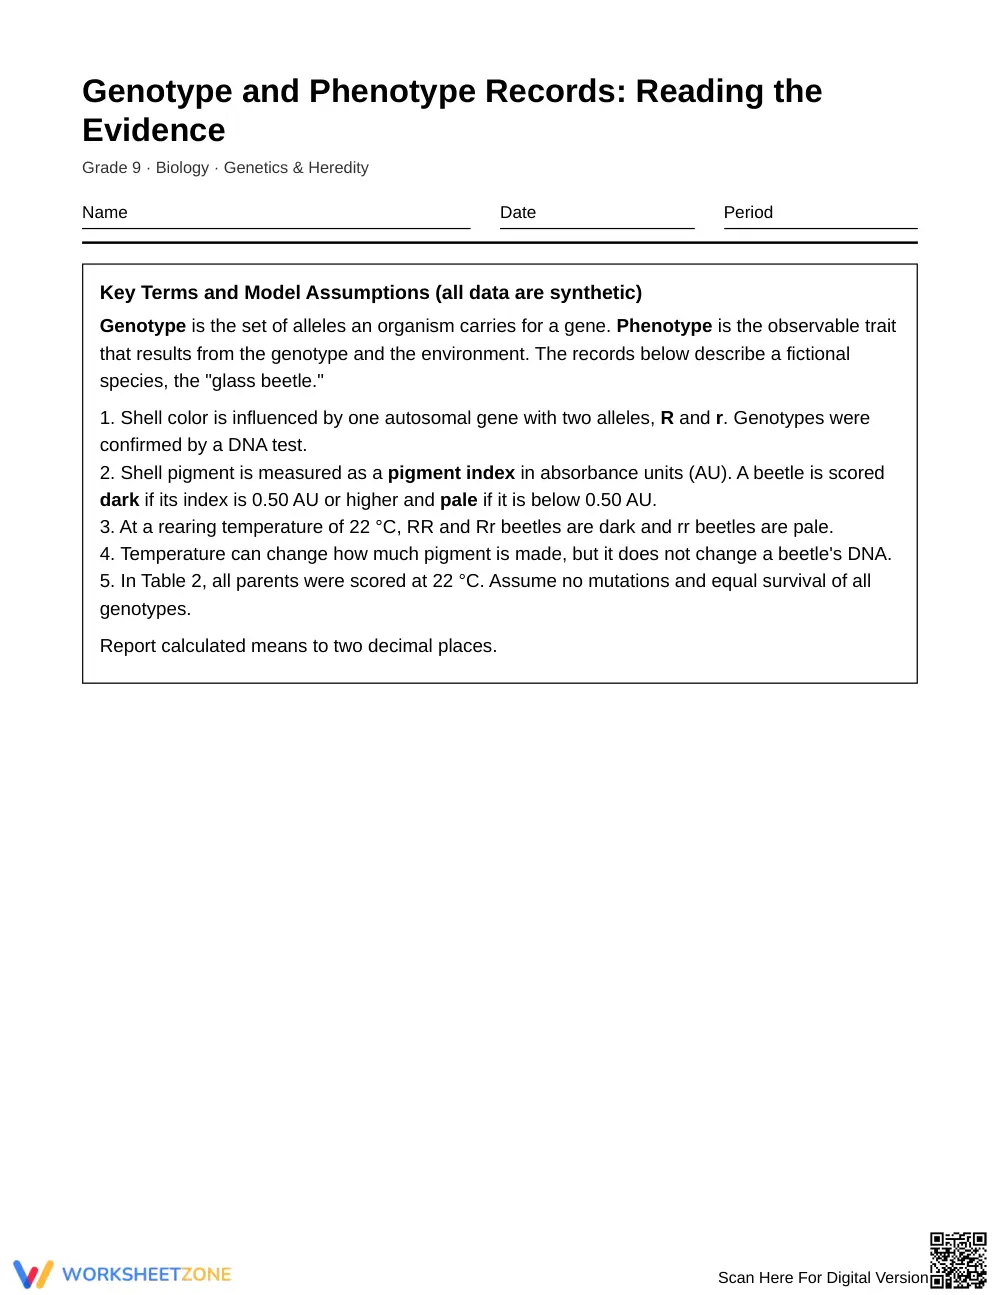
This worksheet teaches students to compare genotype and phenotype records and decide what the data do and do not show. Using synthetic glass beetle tables, students read values, calculate means, reason about temperature effects, and evaluate claims about inheritance with numbers as evidence.
At a Glance
- Grade: 9 · Subject: Biology
- Standard:
No code assigned— Use records to link alleles, observable traits, and temperature.- Skill Focus: Comparing genotype and phenotype records
- Format: 5 pages · 10 problems · Answer key included · PDF
- Best For: Data-based genetics practice after instruction
- Time: 40–50 minutes
What's Inside
The 5-page worksheet opens with key terms and five model assumptions, then gives two data tables: 12 individual beetle records and 5 cross records. Tasks include fill-in value reading, multiple choice, calculations, and short written explanations. A 3-page answer key shows worked reasoning for every task.
Skill Progression
- Guided practice (Part A, 2 problems): Students read genotype, pigment index, shell color, and offspring counts exactly as shown in the tables.
- Supported practice (Part B, 6 problems): Students calculate means, compare records, and explain how one genotype can produce two phenotypes, using the stated assumptions.
- Independent practice (Part C, 2 problems): Students critique student claims, name limits of small samples, and say what further evidence would test them.
The sequence follows a gradual-release model: I Do, We Do, You Do.
Standards Alignment
No standard code was supplied for this resource. It supports high school biology expectations that students use evidence to explain how genes and environment together shape traits, and that they judge whether data support a claim. Add your local standard code when copying into lesson plans, IEP goals, or district curriculum mapping tools.
How to Use It
- After direct instruction: Assign Parts A and B as independent work to check whether students separate genotype from phenotype.
- Unit review: Use Part C as a paired discussion or exit task.
While students work, watch whether they treat a color change at 30 °C as a change in DNA. Expect 40–50 minutes in total.
Who It's For
Grade 9 Biology students in a genetics and heredity unit. Students who need support can start with the key terms box and Part A. Pair it with a short lesson on alleles, dominance, and environmental effects on traits.
The Grade 9 Biology worksheet Genotype and Phenotype Records: Reading the Evidence teaches students to compare genotype and phenotype records and explain how alleles and environment together shape observable traits. It contains 10 tasks across 5 pages, plus a 3-page answer key, and uses synthetic glass beetle data so students practice evidence-based reasoning without prior knowledge of a real species. Students read exact values, calculate mean pigment indices to two decimal places, interpret a 22 °C versus 30 °C temperature effect, and judge whether small samples can support a general claim. The task sequence follows the gradual release model described by Fisher & Frey (2014), moving from guided reading of data to independent evaluation of limitations. No standard code was supplied for this resource, so teachers can map it to their local genetics and heredity standard. It suits direct-instruction follow-up, review, and formative assessment in a genetics unit.


