


























Views
Downloads


Graphing Data Worksheet: Printable Grade 5 Exit Ticket
Paste this activity's link or code into your existing LMS (Google Classroom, Canvas, Teams, Schoology, Moodle, etc.).
Students can open and work on the activity right away, with no student login required.
You'll still be able to track student progress and results from your teacher account.
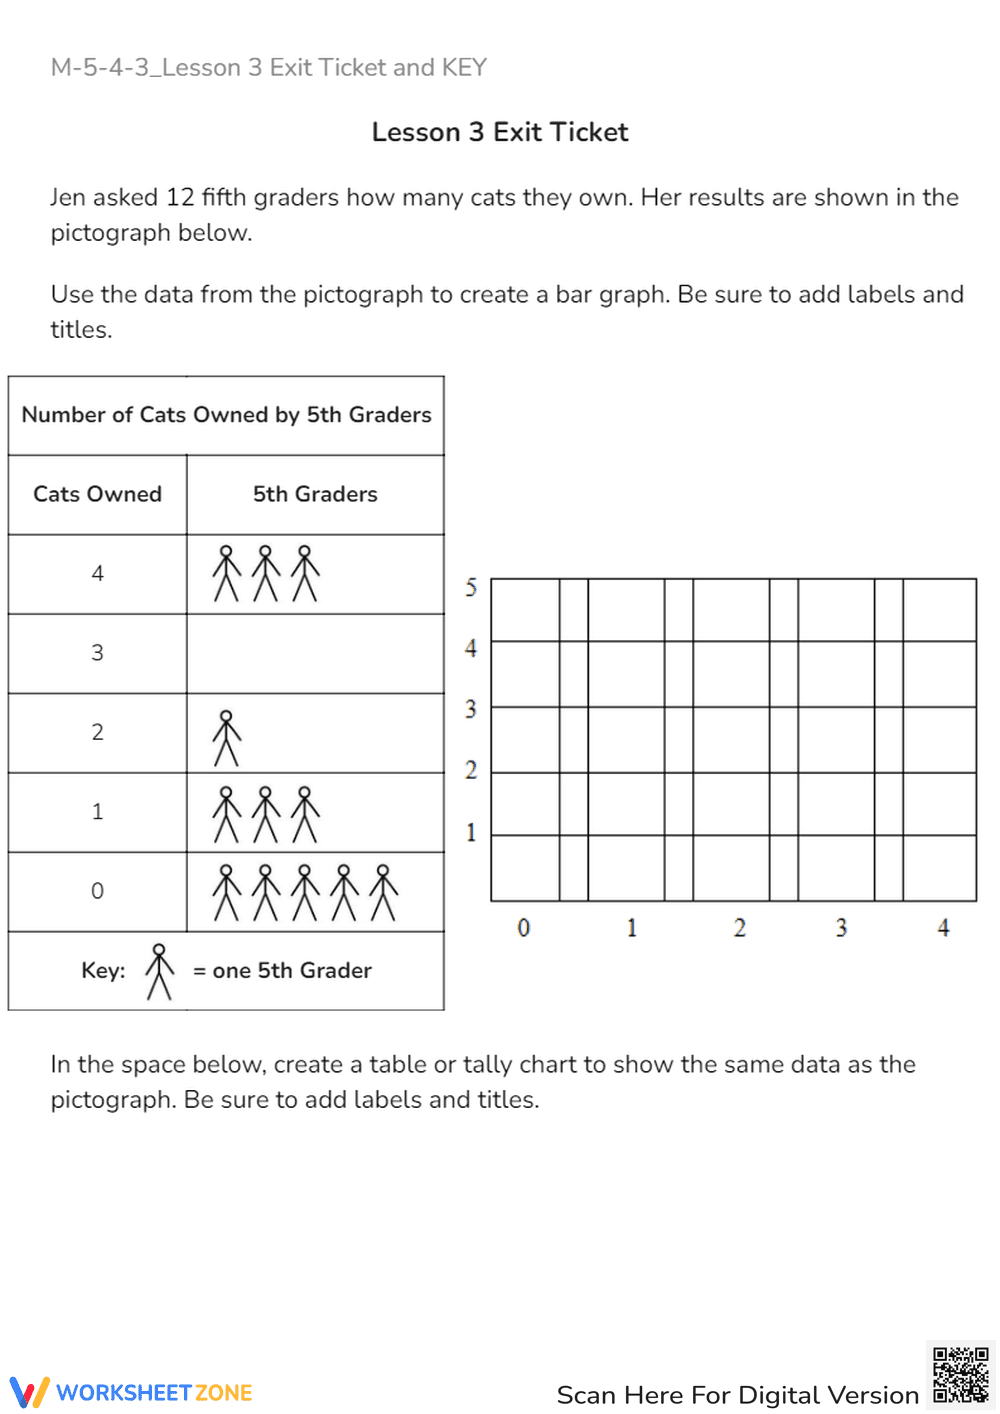
This printable math worksheet helps fifth-grade students master data representation by converting pictograph data into bar graphs and tally charts. Students analyze pet ownership data to construct visual models, improving their graphing precision. This resource provides immediate feedback to support classroom instruction.
At a Glance
- Grade: Grade 5 · Subject: Math and Data Analysis
- Standard:
CCSS.MATH.CONTENT.5.MD.B.2— Represent and interpret data by creating visual graphs and structured tables- Skill Focus: Converting pictographs to bar graphs and tally charts
- Format: 2 pages · 2 distinct graphing problems · Full answer key included · PDF
- Best For: Quick formative assessment or classroom exit ticket
- Time: 10–15 minutes of independent work
This two-page PDF contains a student worksheet and a complete answer key. The worksheet presents a pictograph showing cats owned by 12 fifth graders, an empty grid for a bar graph, and space for a tally chart. The layout includes clear labels to guide independent student work.
Zero-Prep Classroom Workflow
This resource requires under 2 minutes of teacher preparation. Follow these steps to integrate it:
- Print (1 minute): Print the student worksheet and keep the key handy.
- Distribute (30 seconds): Hand out the worksheet as an exit ticket or sub plan.
- Review (30 seconds): Use the visual answer key to project correct answers for quick grading.
Standards Alignment
This activity aligns with `CCSS.MATH.CONTENT.5.MD.B.2`, focusing on representing and interpreting data. Students also practice foundational skills for `CCSS.MATH.CONTENT.3.MD.B.3` by drawing scaled graphs. Both standard codes can be copied directly into lesson plans, IEP goals, or district curriculum mapping tools.
How to Use It
Use this worksheet as a formative assessment after direct instruction. Observe whether students correctly apply the pictograph key when drawing their bar graph columns. Alternatively, assign this 10-to-15-minute task as a warm-up activity to reinforce graphing skills before starting a new lesson.
Who It's For
This worksheet is ideal for fifth-grade students learning to organize data. It works well for general education, special education, and English language learners. Pair this activity with a direct instruction lesson on reading graph axes to scaffold the task for struggling learners.
This educational resource targets `CCSS.MATH.CONTENT.5.MD.B.2` by focusing on the plain-English skill of translating data from pictographs into bar graphs and tables. According to research from Fisher & Frey (2014) on the gradual release of responsibility, structured exit tickets serve as vital formative assessment tools that bridge guided practice and independent mastery. By requiring students to label axes, interpret keys, and construct tables, this worksheet reinforces the spatial and organizational skills necessary for advanced data literacy. The inclusion of a complete visual answer key supports immediate feedback loops, which have been shown to significantly improve student retention of mathematical concepts. Educators can confidently integrate this high-quality, zero-prep tool into their daily math routines to measure student progress, identify common graphing misconceptions, and guide subsequent small-group interventions to ensure all learners achieve standard proficiency in data representation.


