


















Essential Travel-Time Table Worksheet | Grade 8 Science
Paste this activity's link or code into your existing LMS (Google Classroom, Canvas, Teams, Schoology, Moodle, etc.).
Students can open and work on the activity right away, with no student login required.
You'll still be able to track student progress and results from your teacher account.
This science worksheet trains middle school students to analyze seismic travel-time tables, determine S − P arrival intervals, and calculate distances to earthquake epicenters. Students master core seismology data analysis skills through stepped calculations, data interpolation, and conceptual synthesis questions that connect numerical calculations to real-world seismic station monitoring.
At a Glance
- Grade: 8 · Subject: Science
- Standard: Analyze seismic data to locate epicenters and determine earthquake wave travel
- Skill Focus: Read a Supplied Travel-Time Table
- Format: 5 pages · 10 problems · Answer key included · PDF
- Best For: Guided practice and independent data analysis
- Time: 40–50 minutes
What's Inside
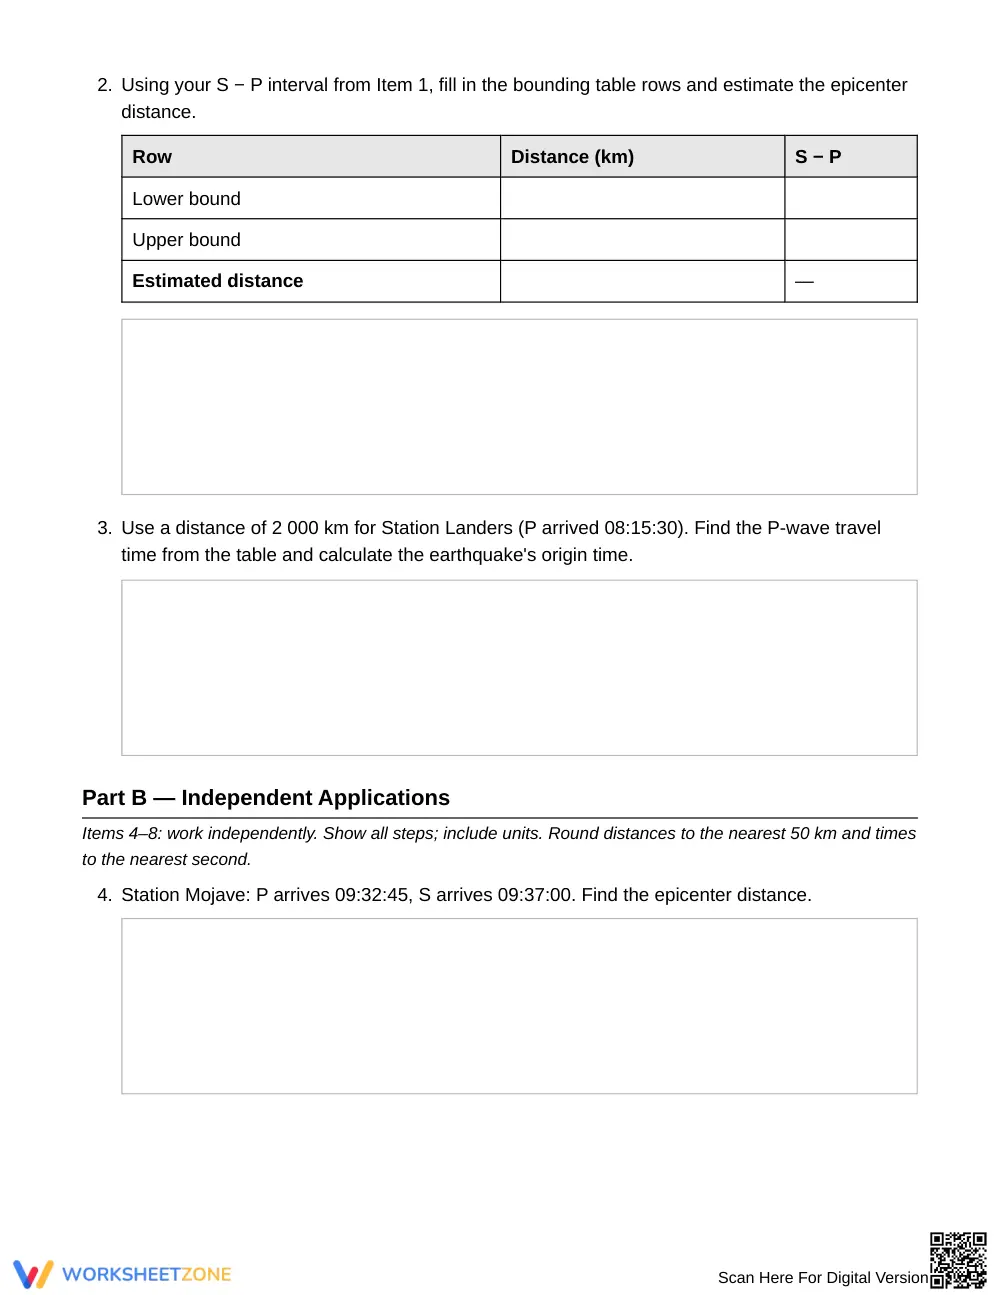
The 5-page printable packet features an explicit reference table of P-wave and S-wave travel times up to 5,000 kilometers, followed by two fully worked examples modeling interval arithmetic and linear interpolation. Across 10 targeted problems divided into three distinct sections, students calculate arrival time differentials, trace origin times backwards, and evaluate conceptual misconceptions. A comprehensive 3-page answer key provides complete step-by-step solutions for rapid grading.
Skill Progression
- Guided Practice (Items 1–3): Students walk through a structured, multi-part task that isolates each sub-skill, using a bounding-box table to interpolate epicenter distance and subtract P-wave travel time to establish earthquake origin time.
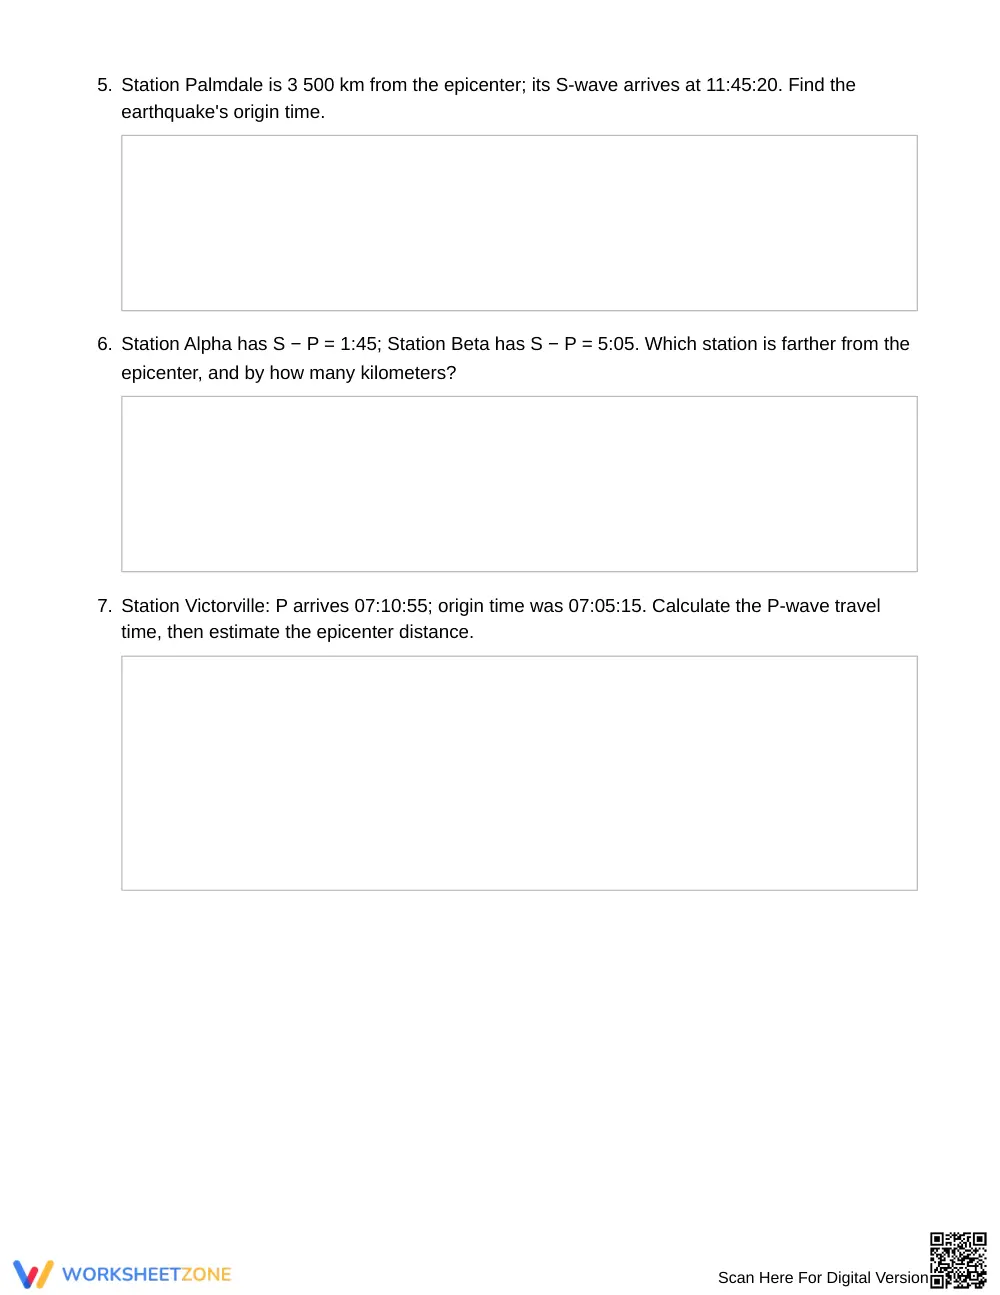
- Supported Practice (Items 4–6): Learners independently apply interval formulas to individual seismic stations, compute differential distances across multiple recording sites, and determine origin times from S-wave arrivals.
- Independent Application (Items 7–10): Unscaffolded synthesis items require students to determine distance between opposing stations and craft evidence-based explanations evaluating common seismic misconceptions.
This sequence embodies a gradual-release architecture, shifting students from step-by-step table extraction to rigorous scientific reasoning.
Standards Alignment
This activity aligns with middle school Earth Science standards targeting the analysis and interpretation of geoscience data to understand internal Earth processes and natural hazards. Students synthesize empirical tables to model wave propagation, compute differential rates, and justify triangulation principles. The standard expectations can be copied directly into lesson plans, IEP goals, or district curriculum mapping tools.
How to Use It
Deploy this resource directly after introducing seismic wave types (P-waves and S-waves) during your plate tectonics or natural hazards unit. Use Part A as collaborative practice immediately following direct instruction, pausing to check student rounding on linear interpolation before releasing them to Part B. Expect the 10 problems to take between 40 and 50 minutes. For formative assessment, inspect Item 9 to ensure students recognize that interval length indicates epicenter distance rather than earthquake magnitude.
Who It's For
Designed for general Grade 8 science classes, this resource also supports high school Earth Science review and physical science interventions. Pair this worksheet directly with an earthquake epicenter triangulation lab or a seismic wave seismogram reading lesson.
Middle school science curricula frequently require students to interpret quantitative Earth science data, yet standard textbooks rarely offer sufficient computational practice with seismic interval tables. According to research on structured cognitive scaffolding by Fisher & Frey (2014), students demonstrate significantly higher retention and transfer when complex graphical and tabular interpretations are broken into phased analytical steps. This worksheet provides direct instruction models alongside 10 targeted practice prompts, requiring students to extract P-wave and S-wave intervals, interpolate distances, and compute origin times. By grounding abstract wave mechanics in concrete calculation tables, the lesson solidifies critical data literacy and prepares eighth-grade learners for advanced high school Earth science coursework.


