


























Views
Downloads




Essential Phase Change Worksheet | Grade 7 Science
Paste this activity's link or code into your existing LMS (Google Classroom, Canvas, Teams, Schoology, Moodle, etc.).
Students can open and work on the activity right away, with no student login required.
You'll still be able to track student progress and results from your teacher account.
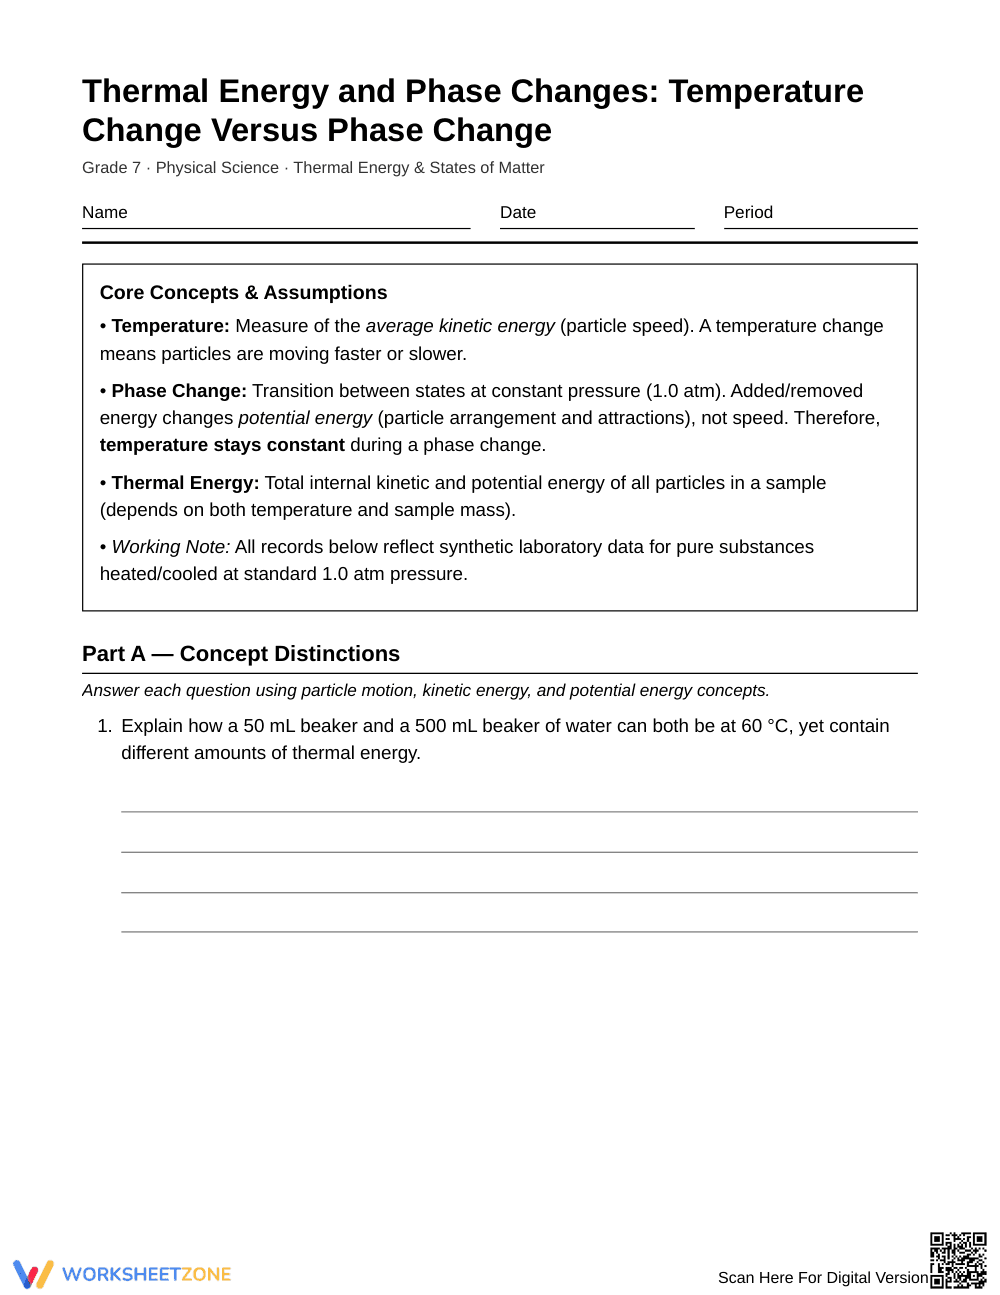
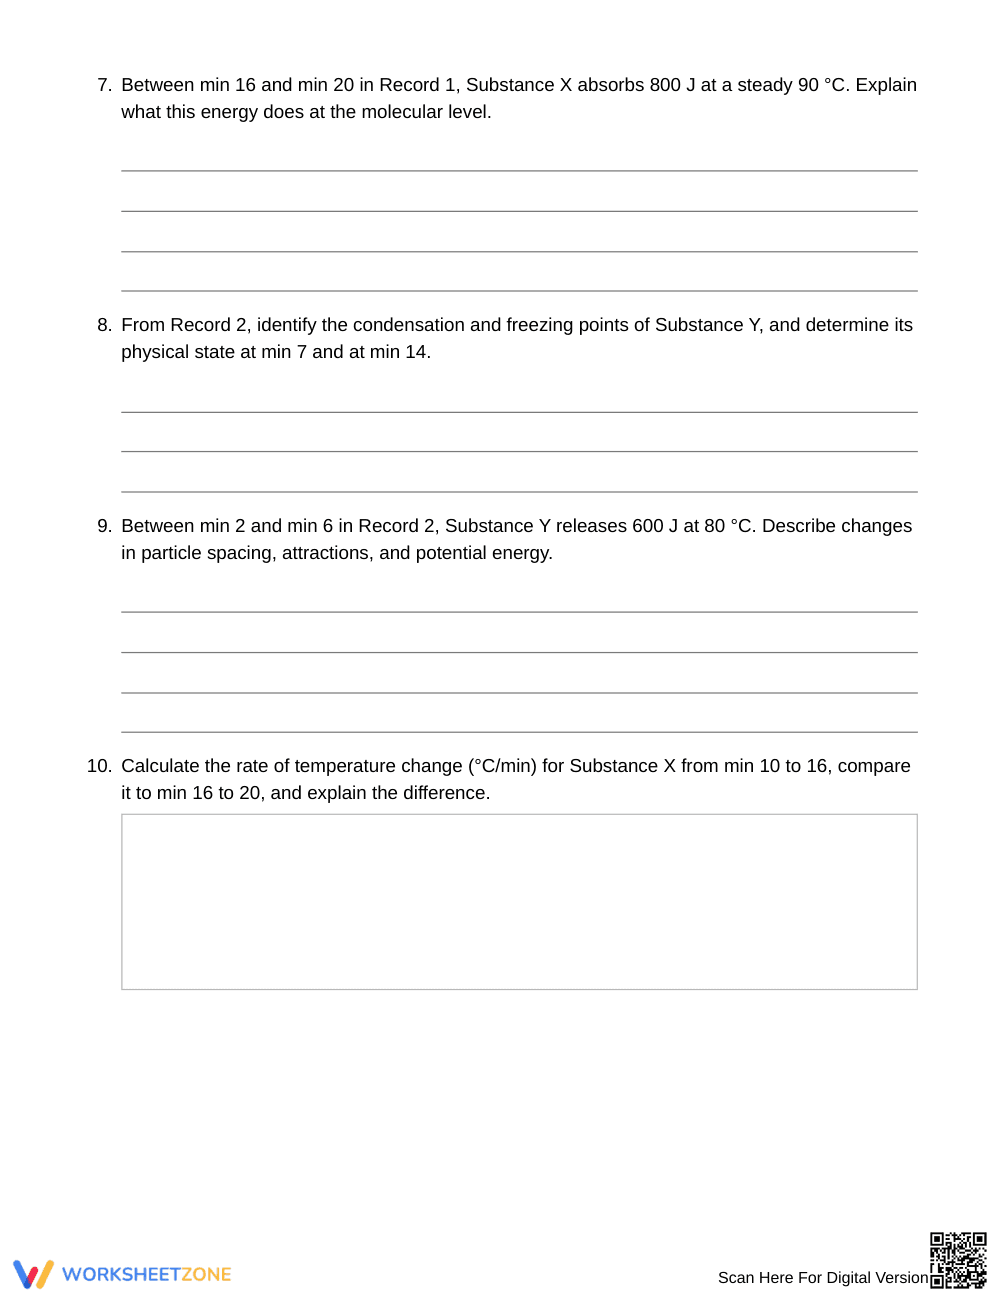
This physical science worksheet equips middle school students to distinguish between thermal energy changes that alter temperature and those that drive phase changes. Learners examine heating and cooling data, track kinetic versus potential energy at the particle level, and explain why plateau regions on thermal curves occur without temperature changes.
At a Glance
- Grade: 7 · Subject: Science
- Standard: Thermal Energy — Track particle motion, temperature, and state changes during heating or cooling
- Skill Focus: Temperature Change Versus Phase Change
- Format: 5 pages · 12 problems · Answer key included · PDF
- Best For: Mid-unit practice or assessment review
- Time: 40–50 minutes
What's Inside: The 5-page printable resource includes a foundational reference box defining key terms, followed by 12 multi-part analytical questions and synthetic laboratory data tables for two substances. A comprehensive 3-page answer key provides complete qualitative explanations and sample temperature rate calculations.
Skill Progression
- Guided Practice (Part A, Items 1–4): Scaffolds core distinctions between thermal energy, temperature, and latent heat through structured conceptual comparisons using beaker models and heating curve segments.
- Supported Practice (Part B, Items 5–10): Guides students through synthetic lab tables to determine melting points, calculate rates of heating in °C/min, and explain plateau regions using molecular attraction models.
- Independent Practice (Part C, Items 11–12): Challenges learners to generate justified predictions for multi-phase mixtures and continuous cooling curves without prompts or hints.
This sequence follows a gradual-release framework, transitioning students from qualitative conceptual identification to independent quantitative and predictive analysis.
Standards Alignment
This worksheet aligns with middle school physical science standards addressing matter and its interactions. Specifically, students develop and use models to describe how the total thermal energy of a system changes in relation to temperature and phase transitions, showing that average kinetic energy remains constant during state changes while potential energy shifts. Both standard concepts can be copied directly into lesson plans, IEP goals, or district curriculum mapping tools.
How to Use It
Implement this resource directly after direct instruction on heating curves and latent heat. During classwork, circulate while students complete Part B and check whether they incorrectly equate steady plateaus with a pause in heat transfer; redirect them by prompting for potential energy changes. The full 12-task packet takes approximately 40 to 50 minutes to complete.
Who It's For
Designed for Grade 7 physical science classrooms, this activity supports general education students and emerging bilingual learners needing structured data tables. Pair this worksheet with an interactive states-of-matter computer simulation or an introductory laboratory investigation on ice melting to reinforce observable and microscopic phenomena.
According to EdReports 2024 evaluations of middle school science materials, rigorous physical science instruction requires students to interpret quantitative heating data alongside particle-level mechanism models rather than merely memorizing vocabulary terms. This Grade 7 thermal energy worksheet directly targets that expectation through 12 rigorous tasks combining tabular data analysis with microscopic explanations of particle motion, kinetic energy, and intermolecular attractions. By contrasting slanted warming segments with flat phase transitions, students resolve common misconceptions regarding constant temperatures during boiling and freezing. A study by Fisher & Frey (2014) emphasizes that scaffolded progressions shifting from conceptual contrast to unassisted prediction yield significantly deeper retention of complex physical principles. The included 3-page answer key offers complete scientific rationales, providing middle school educators with a reliable tool for tracking standards-aligned conceptual mastery.


