































Essential Offspring Ratios Worksheet | Grade 10 Biology

Paste this activity's link or code into your existing LMS (Google Classroom, Canvas, Teams, Schoology, Moodle, etc.).
Students can open and work on the activity right away, with no student login required.
You'll still be able to track student progress and results from your teacher account.
This Grade 10 genetics worksheet develops student mastery in evaluating quantitative inheritance data across Mendelian and non-Mendelian crosses. High school biology learners calculate theoretical expectations using the product rule, compute sample deviations, and evaluate how sample sizes influence empirical inheritance outcomes.
At a Glance
- Grade: 10 · Subject: Biology
- Skill Focus: Comparing predicted and observed offspring ratios
- Format: 5 pages · 10 problems · Answer key included · PDF
- Best For: Quantitative genetics practice and data analysis
- Time: 45–60 minutes
What's Inside
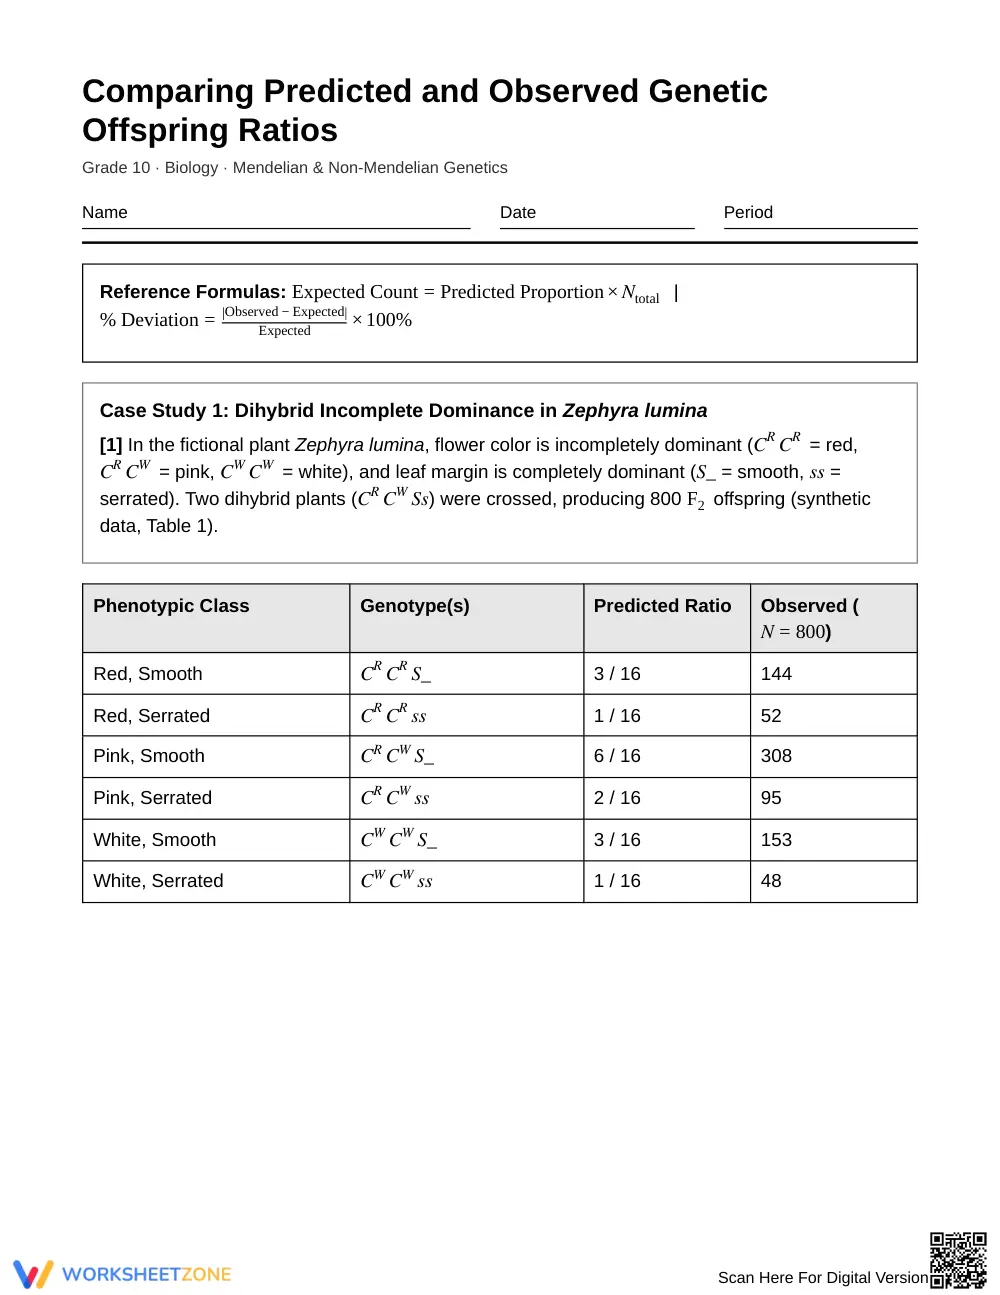
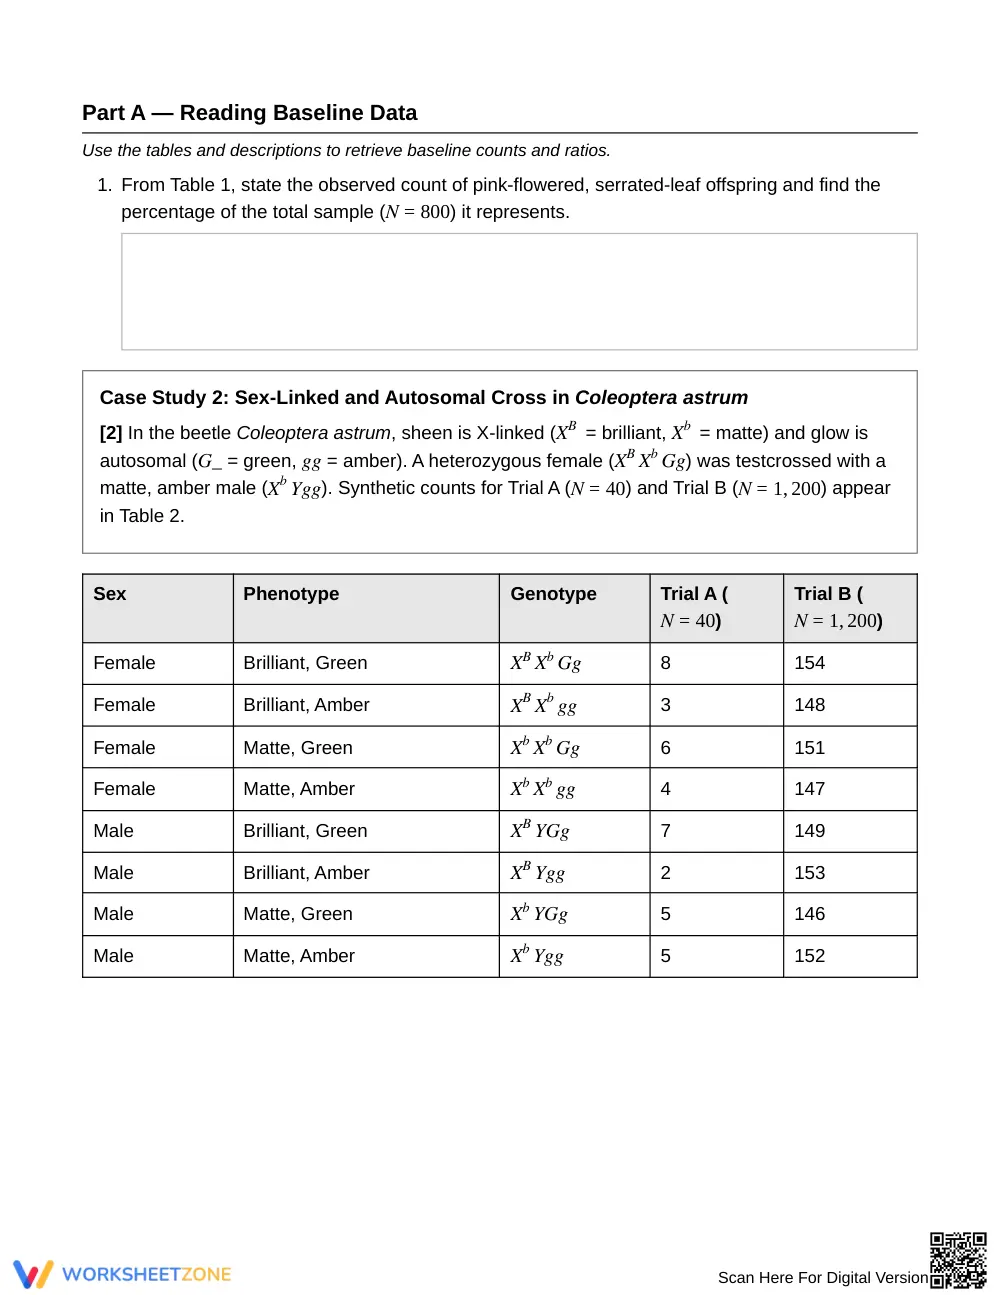
The 5-page worksheet presents two comprehensive genetic case studies featuring dihybrid incomplete dominance in fictional botany and sex-linked autosomal inheritance in insect models. It provides 10 structured analytical tasks, detailed reference formulas for expected counts and percent deviation, and a complete 2-page step-by-step teacher answer key.
Skill Progression
- Guided Practice (Part A, Tasks 1–2): Students extract baseline empirical counts and compute starting phenotypic percentages from structured sample tables with explicit guidance.
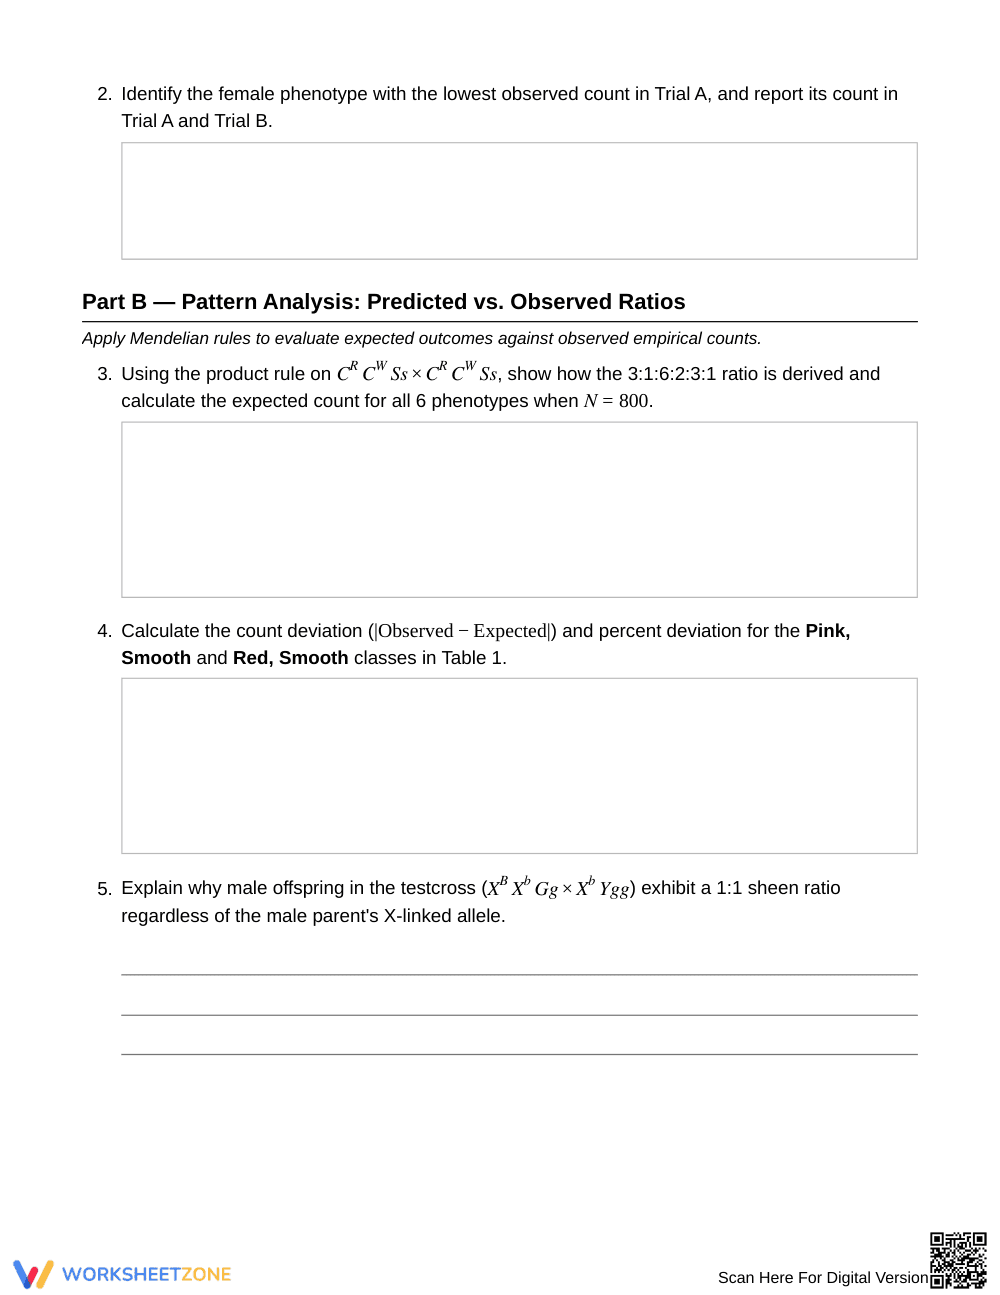
- Supported Practice (Part B, Tasks 3–8): Learners apply the product rule to dihybrid crosses, compute mathematical deviations, analyze sex-linked testcrosses, and contrast empirical data against blending inheritance and gene linkage.
- Independent Practice (Part C, Tasks 9–10): Students synthesize findings to evaluate sample size bias (N=40 vs. N=1,200) and articulate how biological assumption violations distort observed ratios.
This structured progression reflects the gradual-release model, advancing students from foundational data retrieval to rigorous quantitative evaluation.
Standards Alignment
This resource aligns with high school life science standards addressing heredity and trait distribution. Students apply probability models to determine phenotypic frequencies and explain discrepancies between predicted Punnett square distributions and empirical data sets. Both standard concepts can be copied directly into lesson plans, IEP goals, or district curriculum mapping tools.
How to Use It
Deploy this worksheet after direct instruction on dihybrid Punnett squares, sex-linked traits, and non-Mendelian dominance patterns. It functions effectively during guided classroom problem-solving or as a post-instruction summative lab application. During work time, formatively check whether students correctly use the total sample size when converting predicted fractions into expected counts. Expect completion within 45 to 60 minutes.
Who It's For
Designed for Grade 10 general biology and honors life science students, this resource includes explicit mathematical formulas to support emerging problem solvers while challenging advanced learners with non-Mendelian linkage questions. Pair this activity directly with a dihybrid corn cross lab or an interactive Punnett square simulation.
According to the National Research Council (2012), high-quality biology instruction requires secondary learners to systematically integrate quantitative reasoning and empirical data evaluation directly within foundational life science curriculum topics. This comprehensive Grade 10 genetics resource actively reinforces that educational standard by challenging high school students to solve 10 rigorous analytical tasks. Learners calculate theoretical probabilities, determine expected mathematical values across dihybrid crosses, quantify phenotypic percentage deviations, and critically assess how experimental sample size differences distort observed ratios. By evaluating real-world inheritance data sets, examining non-Mendelian sex linkage, and contrasting empirical counts against baseline expectations, students construct an enduring conceptual bridge between theoretical Punnett square predictions and authentic biological research. Integrating these structured statistical analysis activities within your genetics unit equips biology students with the necessary problem-solving proficiencies, analytical precision, and data literacy demanded across advanced secondary science coursework.


