































Essential Genetic Models Worksheet | Grade 10 Biology

Paste this activity's link or code into your existing LMS (Google Classroom, Canvas, Teams, Schoology, Moodle, etc.).
Students can open and work on the activity right away, with no student login required.
You'll still be able to track student progress and results from your teacher account.
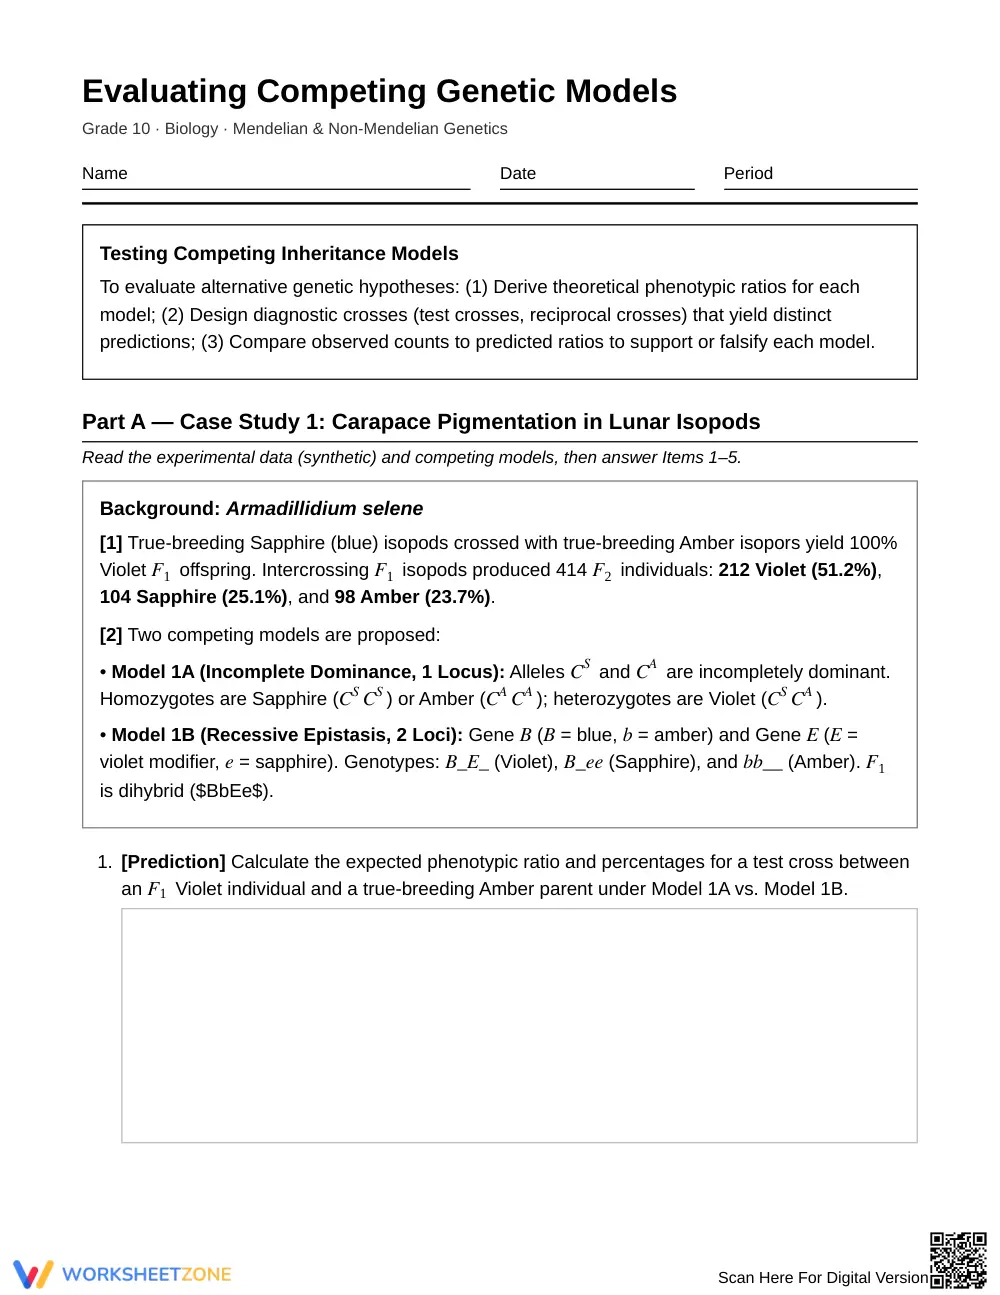
This Grade 10 biology worksheet guides students to analyze experimental data, derive expected phenotypic ratios, and evaluate competing genetic models. Through two structured case studies, learners practice comparing Mendelian and non-Mendelian hypotheses—including incomplete dominance, recessive epistasis, X-linkage, and sex-limited expression—to determine which biological model best explains observed inheritance patterns.
At a Glance
- Grade: 10 · Subject: Biology
- Standard: High School Genetics — Evaluate competing hypotheses and compare theoretical phenotypic ratios against experimental data
- Skill Focus: Compare Two Genetic Models Against Data
- Format: 4 pages · 10 problems · Answer key included · PDF
- Best For: High school genetics data analysis practice
- Time: 45–60 minutes
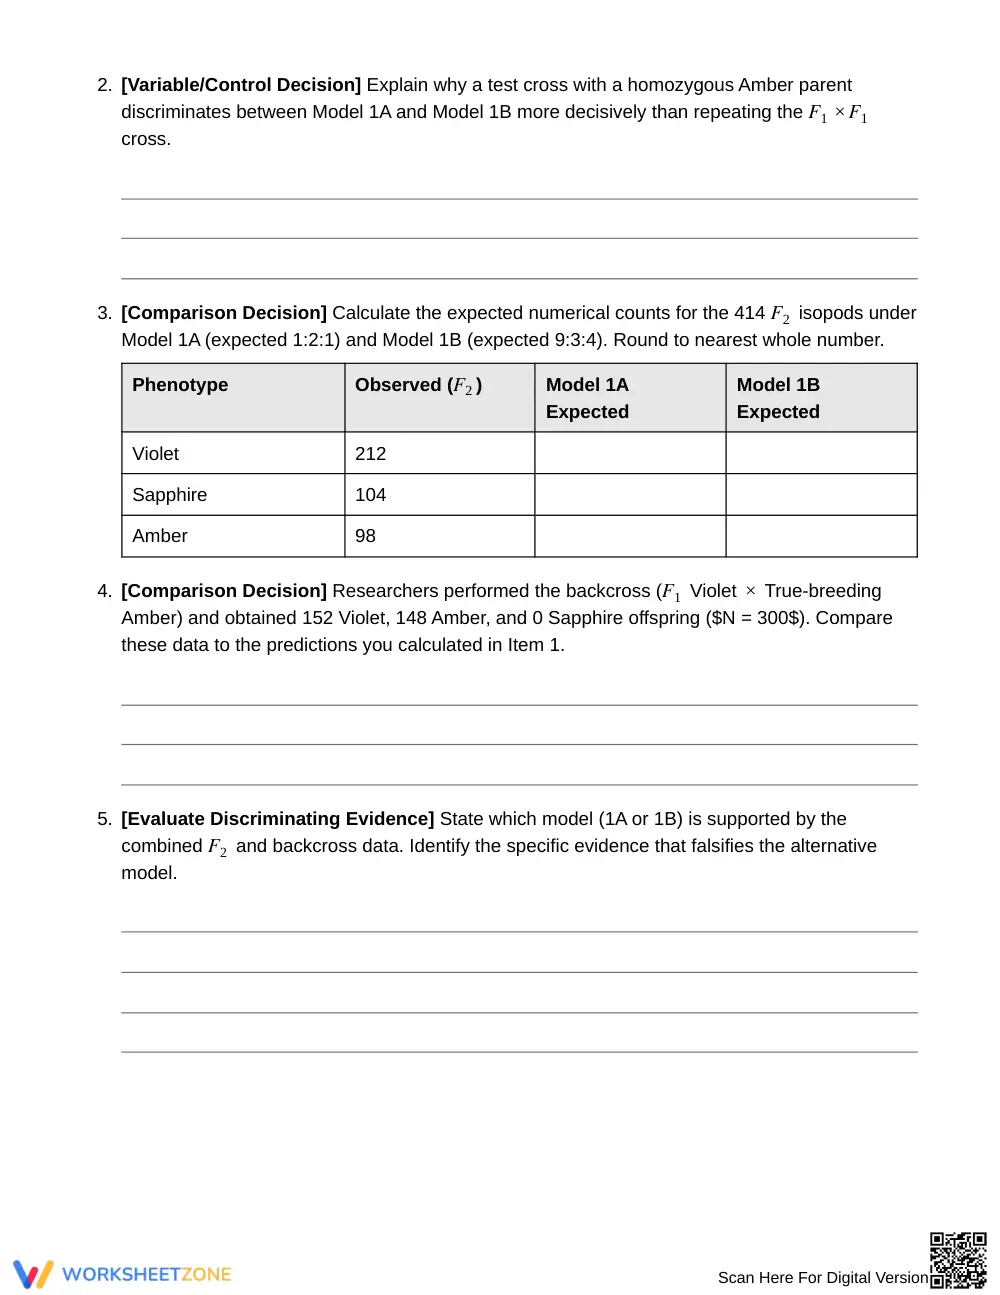
This 4-page worksheet includes 10 analytical items organized into two multi-part case studies: Carapace Pigmentation in Lunar Isopods and Antenna Patterns in Desert Midges. Students encounter structured data tables, theoretical prediction prompts, diagnostic cross evaluations, and falsification analyses. The resource includes a comprehensive 2-page answer key detailing expected phenotypic ratios, completed data tables, and explicit rationale for model selection.
Skill Progression
- Guided practice (Items 1–3): Students calculate expected phenotypic ratios and populate structured comparison tables to evaluate single-locus incomplete dominance against two-locus recessive epistasis.
- Supported practice (Items 4–7): Learners evaluate backcross data, identify falsifying evidence, and predict reciprocal cross outcomes comparing X-linked inheritance with sex-limited autosomal models.
- Independent practice (Items 8–10): Students independently differentiate autosomal and sex-linked inheritance across generations, articulate biological mechanisms, and formulate evidence-based conclusions.
This structured progression leverages the gradual-release framework, moving students systematically from calculating baseline expectations to constructing rigorous, evidence-based genetic arguments.
Standards Alignment
This resource aligns with high school biology life science standards focused on heredity and inheritance patterns. Students use mathematical thinking and empirical evidence to evaluate how traits are passed across generations through interacting genes and sex chromosomes. Both standard codes can be copied directly into lesson plans, IEP goals, or district curriculum mapping tools.
How to Use It
Assign this worksheet after direct instruction on non-Mendelian inheritance and epistasis to reinforce scientific reasoning. It functions effectively as a collaborative partner investigation or an individual formative assessment. While students complete Part A, check their expected numerical count calculations in Item 3 to ensure they accurately apply the 9:3:4 dihybrid ratio before they attempt the falsification analysis. Most high school biology classes will complete all 10 problems within 45 to 60 minutes.
Who It's For
This worksheet is tailored for Grade 10 general and honors biology students developing data interpretation and hypothesis testing skills. For students needing scaffolding, provide Punnett square templates for the dihybrid crosses; advanced students can calculate chi-square goodness-of-fit statistics on the 414 isopod counts. Pair this activity with an introductory lecture or interactive simulation on epistasis and sex-linked inheritance.
According to Fisher & Frey (2014), structured biological problem sets that require students to compare competing models against quantitative evidence significantly enhance conceptual transfer and analytical reasoning. This Grade 10 genetics resource targets the core skill of evaluating competing genetic hypotheses against empirical data across 10 scaffolded tasks. By comparing theoretical phenotypic ratios—such as incomplete dominance versus recessive epistasis and X-linked versus sex-limited traits—students engage in authentic scientific argumentation and falsification logic. The 4-page investigation presents two distinct case studies with empirical datasets, structured calculation tables, and diagnostic cross comparisons. Research shows that guided evaluation of alternative hypotheses helps learners overcome common misconceptions surrounding Mendelian ratios and non-Mendelian interactions. Complete with a 2-page answer key detailing mathematical steps and mechanistic explanations, this instructional worksheet provides high school educators with an evidence-based tool for deepening genetic literacy and quantitative biological analysis.


