































Complete Energy Diagram Worksheet | Grade 8-12 Science

Paste this activity's link or code into your existing LMS (Google Classroom, Canvas, Teams, Schoology, Moodle, etc.).
Students can open and work on the activity right away, with no student login required.
You'll still be able to track student progress and results from your teacher account.
This potential energy diagram modeling worksheet equips students in grades 8 through 12 to analyze reaction energetics, troubleshoot flawed diagrams, and plot catalyzed pathways. Across 15 tasks, learners identify activation energy and enthalpy changes, correct mislabeled models, and explain collision theory dynamics.
At a Glance
- Grade: Grades 8–12 · Subject: Physical Science & Chemistry
- Standard: Construct, evaluate, and revise scientific models showing energy transformations and bond breaking in chemical reactions
- Skill Focus: Potential energy diagram modeling and kinetic analysis
- Format: 4 pages · 15 problems · Complete answer key included · Printable PDF
- Best For: Guided practice on enthalpy, activation energy, and catalyzed reactions
- Time: 40–50 minutes
What's Inside
This 4-page worksheet delivers three modeling sections containing 15 analytical and graphing tasks. Students interpret coordinate points on an uncatalyzed curve, identify errors in draft diagrams, and plot a catalyzed pathway from tabular data. A comprehensive 4-page answer key provides complete numeric solutions, revised diagrams, and collision theory explanations.
Skill Progression
- Guided practice (Part A — 5 tasks): Students read curve coordinates to calculate forward activation energy (50 kJ), reverse activation energy (100 kJ), and enthalpy change (−50 kJ).
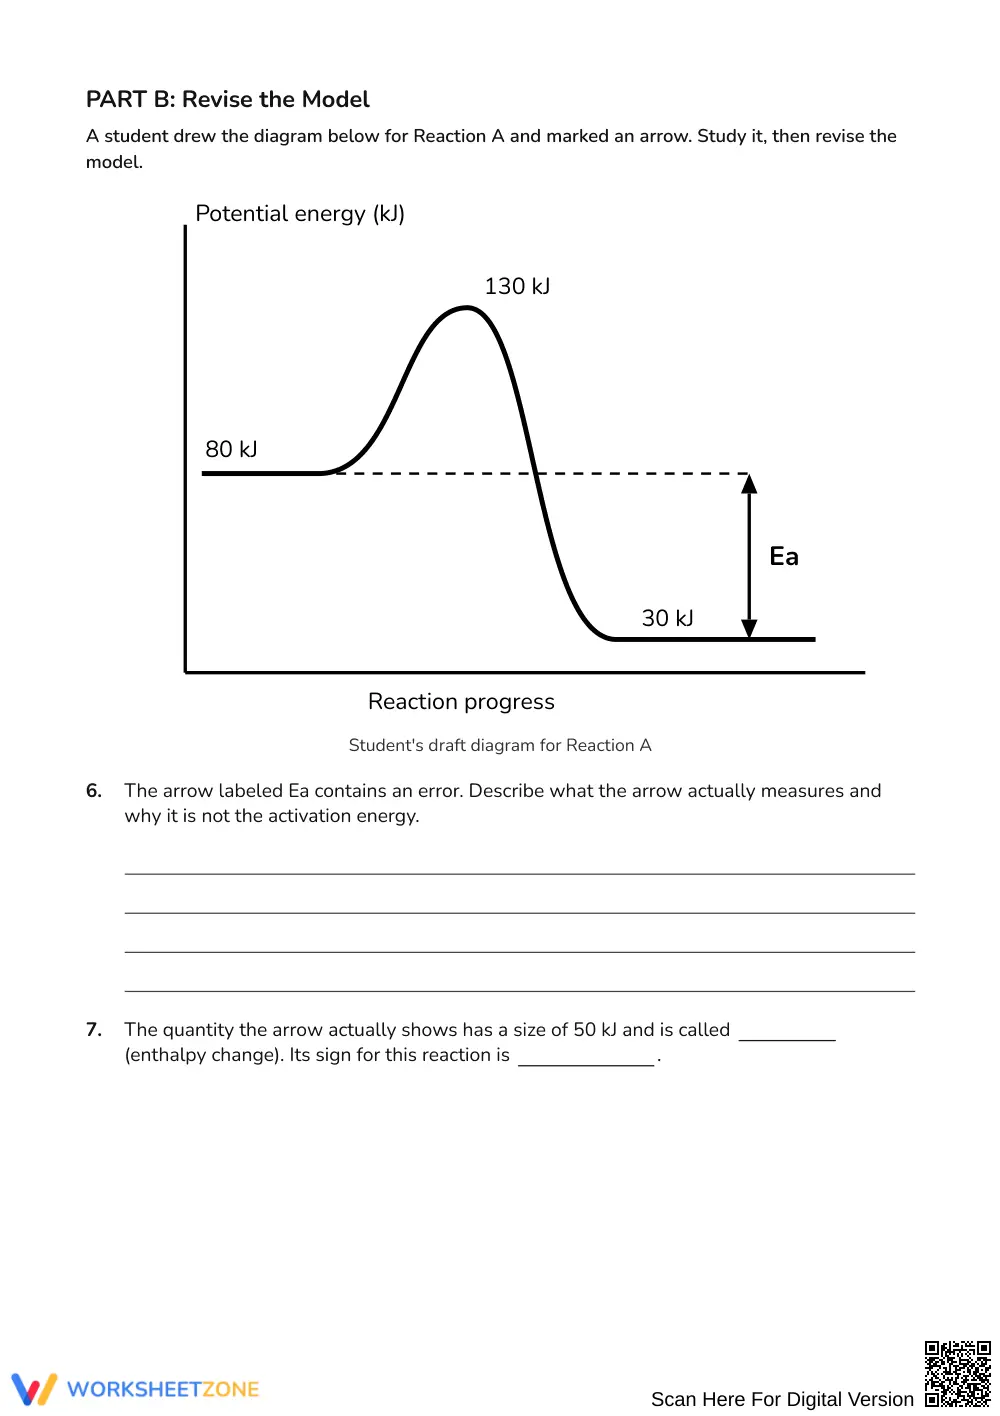
- Supported practice (Part B — 4 tasks): Students critique a flawed student diagram, distinguish activation energy from enthalpy, and reposition energy vectors.
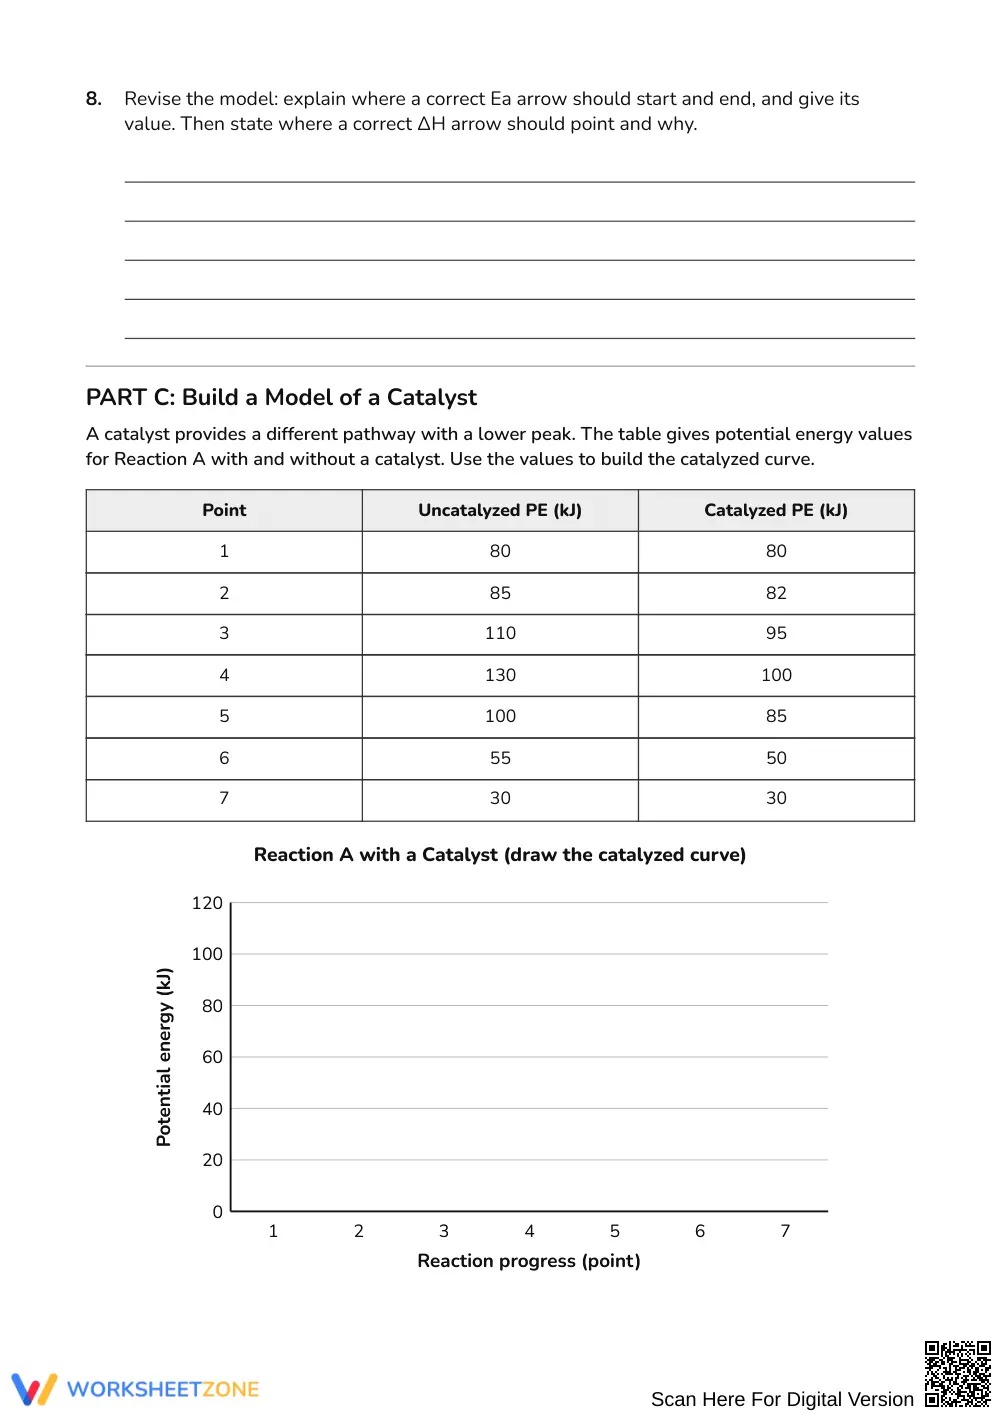
- Independent practice (Part C — 6 tasks): Students plot a catalyzed reaction from data, explaining how reduced activation energy accelerates reaction rates.
This progression applies a gradual-release framework from model evaluation to independent diagram construction.
Standards Alignment
This worksheet supports secondary physical science modeling standards where students develop and revise models illustrating that energy release or absorption in chemical reactions depends on total bond energy changes. Tasks connect activation energy thresholds to particle collisions without introducing unaligned content.
How to Use It
Implement this worksheet after introducing reaction coordinates and collision theory. Facilitate Part A during direct instruction before having student pairs complete the error analysis in Part B (estimated time: 40 to 50 minutes). Formative assessment tip: verify whether students measure activation energy from the reactant plateau rather than the graph baseline, correcting any confusion with net enthalpy immediately.
Who It's For
This resource targets high school chemistry and physical science students exploring reaction kinetics and thermodynamics. Scaffolding is built in through tabular coordinate values for emerging learners, while advanced students analyze reverse reactions. Pair this activity with a catalyzed hydrogen peroxide laboratory demonstration.
Modeling chemical reaction energetics through potential energy diagrams requires learners to coordinate visual representations, quantitative values, and kinetic theory concepts. This 4-page worksheet guides high school science students through interpreting reaction curves, identifying activation energy thresholds, and modeling catalyzed reaction pathways across 15 structured items. According to research on structured instructional design by Fisher & Frey (2014), student conceptual mastery increases significantly when cognitive tasks progress systematically from guided model analysis to active error correction and independent model generation. By requiring students to debug an inaccurate activation energy vector before graphing an authentic catalyzed curve, the activity directly targets common misconceptions regarding enthalpy change and reaction speed. The resulting practice develops durable mental models of molecular collisions and reaction pathways, ensuring that secondary chemistry students achieve proficiency in analyzing quantitative energy diagrams, calculating net enthalpy, and demonstrating how catalysts provide alternative pathways with lower kinetic barriers.


