































Complete DNA Data Analysis Worksheet | Grades 8-12 Science

Paste this activity's link or code into your existing LMS (Google Classroom, Canvas, Teams, Schoology, Moodle, etc.).
Students can open and work on the activity right away, with no student login required.
You'll still be able to track student progress and results from your teacher account.
This comprehensive science worksheet guides students through quantitative DNA analysis, connecting molecular structure to empirical data. Learners analyze double helix anatomy, interpret Chargaff base composition figures across diverse species, and evaluate melting temperature trends across 28 scaffolded tasks to master heredity concepts with evidence-based reasoning.
At a Glance
- Grade: Grades 8–12 · Subject: Science
- Standard: Analyze empirical data tables to explain DNA molecular structure and base pairing
- Skill Focus: DNA Data Table Analysis
- Format: 4 pages · 28 problems · Answer key included · PDF
- Best For: Heredity unit practice or lab review
- Time: 45–60 minutes
What's Inside
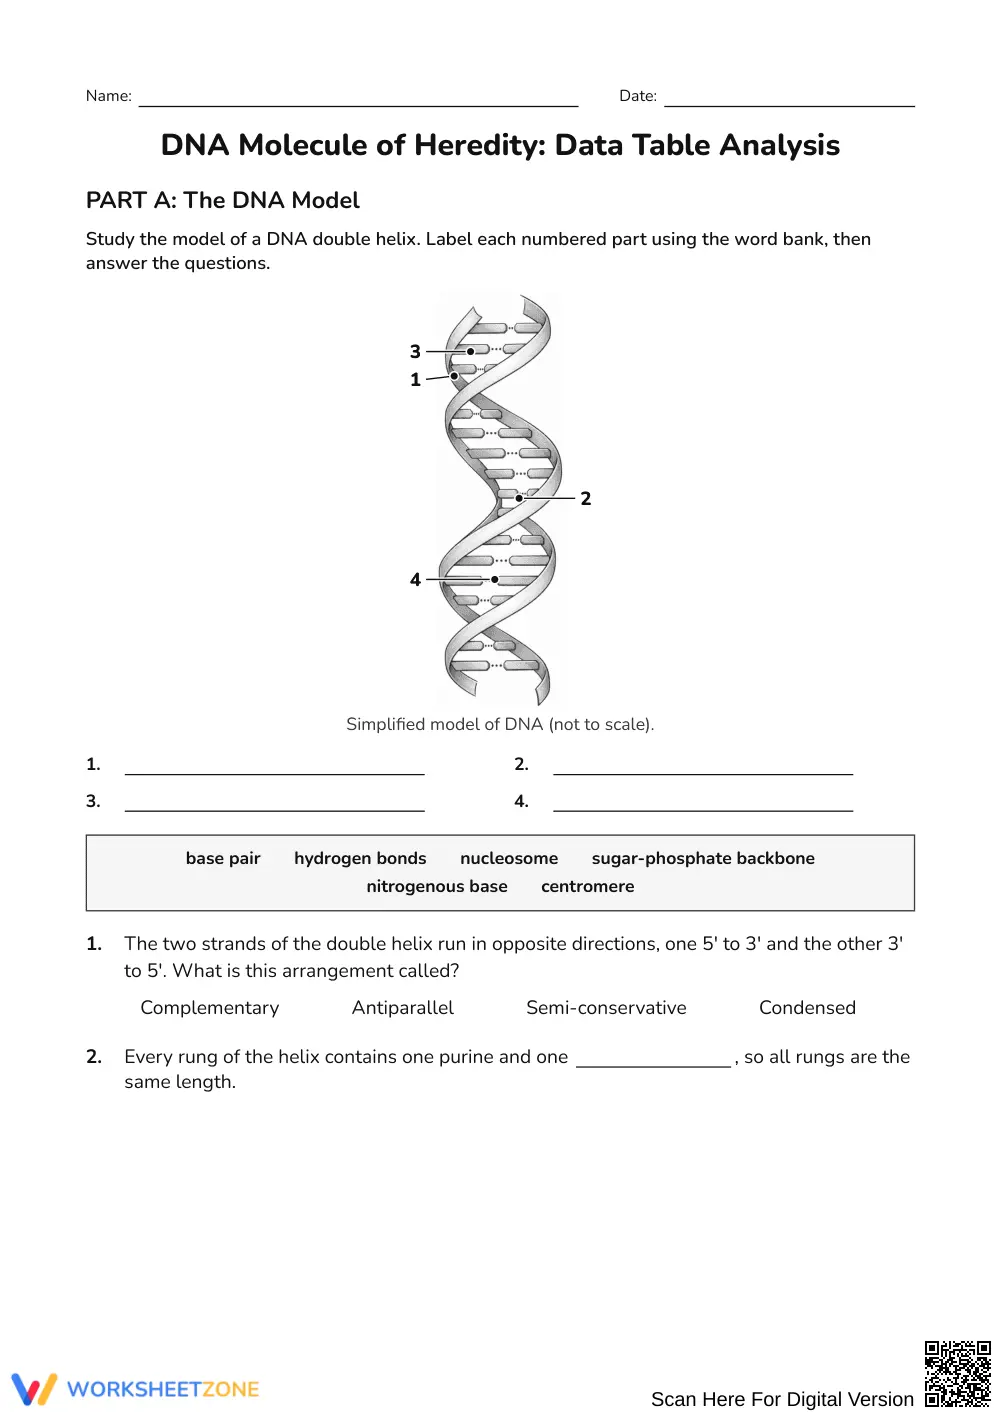
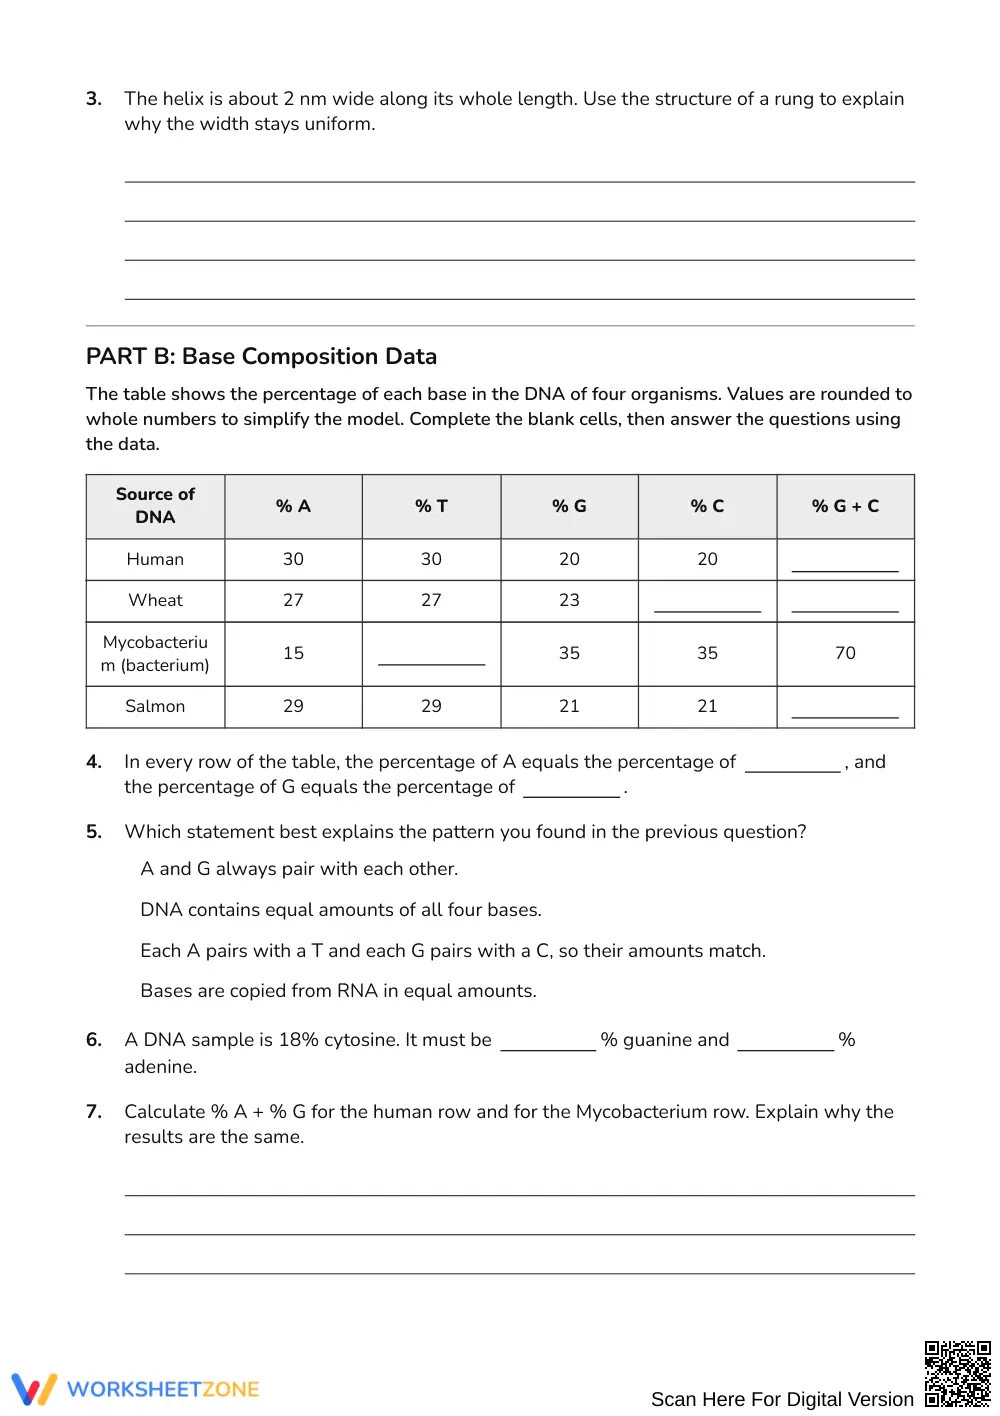
The four-page printable resource features a double helix labeling activity with an integrated word bank, a comparative base percentage table covering four distinct organisms, and a thermal denaturation data set paired with graphing questions. A complete four-page answer key provides step-by-step mathematical solutions and model written responses for every item.
Skill Progression
- Guided practice (Tasks 1–8): Students label core structural components of the DNA molecule using visual cues and define antiparallel geometry.
- Supported practice (Tasks 9–18): Learners complete base percentage tables, compute purine and pyrimidine sums, and compare G-C ratios across species.
- Independent practice (Tasks 19–28): Students graph melting curves, predict thermal stability from hydrogen bonding differences, and defend claims with numerical data.
This sequence embodies the gradual-release framework, shifting students systematically from guided model identification to rigorous independent claim evaluation.
Standards Alignment
This activity aligns with secondary life science standards emphasizing how DNA structure determines hereditary traits and how mathematical representations model biological phenomena. Science curriculum objectives targeting data interpretation and evidence-based explanations are directly supported. Standard competencies can be copied directly into lesson plans, IEP goals, or district curriculum mapping tools.
How to Use It
Deploy this resource during the mid-point of a molecular genetics unit immediately after introducing base pairing rules. Alternatively, assign it as an authentic pre-lab activity before DNA extraction or gel electrophoresis experiments. For formative assessment, inspect student responses to the purine calculation prompt to detect any lingering confusion between base complementary pairing and total percentage sums. Completion requires 45 to 60 minutes.
Who It's For
Designed for general biology, honors life science, and introductory genetics classrooms in grades 8 through 12. Built-in word banks and structured tabular formats support developing readers, while thermal denaturation questions challenge advanced thinkers. Pair this resource directly with an interactive nucleotide physical modeling kit or molecular genetics lecture slides.
According to Fisher & Frey (2014), structured data analysis tasks that integrate visual models with mathematical problem-solving significantly strengthen scientific literacy and conceptual retention. When secondary science students practice interpreting empirical tables—such as evaluating base composition ratios and correlating G-C pairs with thermal stability—they develop measurable competencies in constructing arguments from scientific evidence. Rather than relying on simple recall of adenine and thymine pairing, students synthesize numerical relationships to explain the chemical constraints of the double helix. The structured 28-task progression in this four-page resource mirrors the guided-to-independent release model established in recent empirical studies, ensuring that diverse learners across grades 8 through 12 build verifiable mastery in molecular data analysis, evidence-based argumentation, and quantitative biological reasoning.


