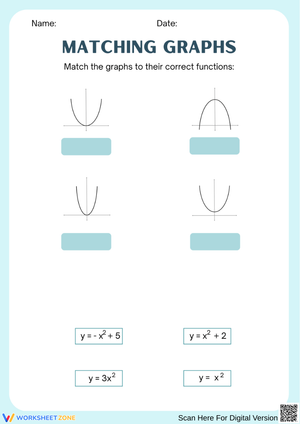
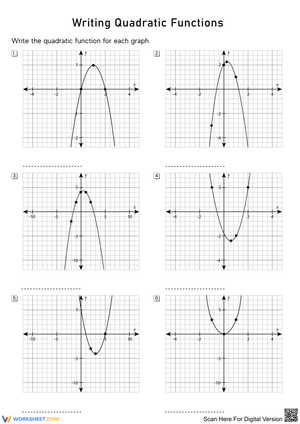
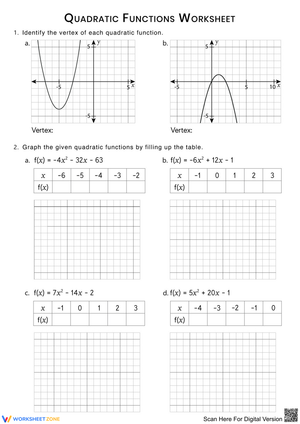
These graphing parabolas printable worksheets for 9th grade give algebra teachers a targeted set of practice resources that move through all three equation forms — standard, vertex, and factored — while keeping each worksheet focused on a specific skill cluster rather than stacking every concept into one exercise. The set builds from extracting key features in isolation to graphing complete parabolas from scratch, which matches how most Algebra 1 units actually sequence this material.
What Each Worksheet Targets
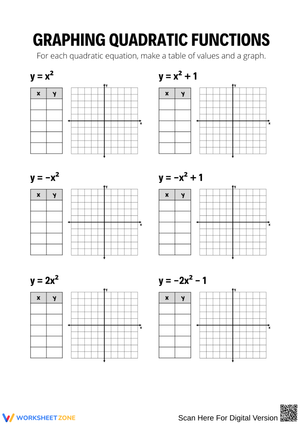
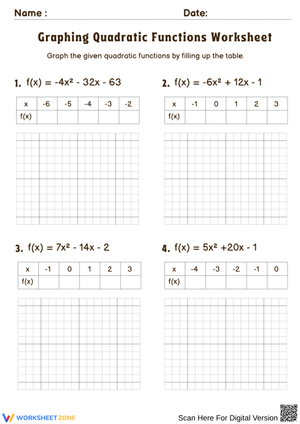
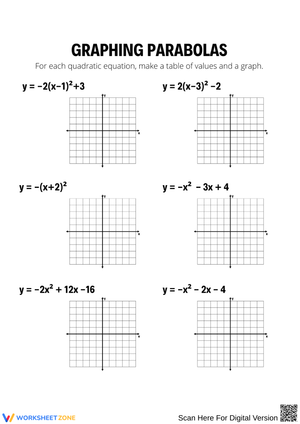
Across the full set, graphing parabolas printable worksheets for 9th grade address five core features: vertex, axis of symmetry, x-intercepts, y-intercept, and direction of opening. Some worksheets ask students to identify these values from an equation before touching the coordinate plane — a deliberate step that breaks the habit of immediately plotting points without understanding what the algebra says first. Others provide a partially completed table of values and ask students to plot and connect, which catches students who calculate the vertex correctly but still draw straight lines between the points rather than a smooth curve.
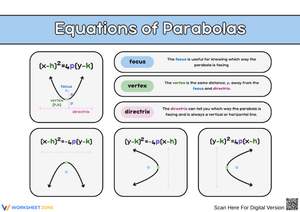
Standard form practice builds around the axis of symmetry formula, then substitution to find the vertex y-coordinate, then a symmetric table of values before the graph gets drawn. Vertex form worksheets shift the emphasis to transformations — students read horizontal shifts, vertical shifts, reflections, and vertical compressions directly from the equation. Factored form exercises reverse the sequence: students find the x-intercepts by setting each factor equal to zero, then locate the vertex at the horizontal midpoint between the roots. Working across all three forms is what the course eventually demands, and each worksheet type builds that flexibility incrementally.
Mistakes Students Make That These Resources Help You Catch
The most persistent error in this unit involves the sign in the axis of symmetry formula. When b is a negative number, the formula yields a positive axis of symmetry — but students who expect a negative result from a negative b will manually flip the sign to make the answer look right to them. The vertex ends up on the wrong side of the y-axis, and every point in the table of values follows it there. This error doesn't always surface during whole-group instruction, because students nod along when the teacher models it. It shows up during independent practice, which is exactly where these worksheets catch it.
Vertex form introduces its own sign confusion. When students see f(x) = a(x minus 3)² + k, many record the vertex x-coordinate as negative 3, reading the subtraction symbol as part of the value rather than as the structure of the form. The error is immediately visible on the worksheet — the axis of symmetry sits at x = negative 3 when the graph should be shifted three units to the right — which makes these exercises useful diagnostic tools during the guided practice phase, not just repetition drills.
A third pattern is graphing-specific: students who plot three points — the vertex plus one on each side — and draw straight lines between them, producing a pointed V instead of a parabola. Most of the graphing worksheets in the set use a five-point table of values by default, which gives students enough plotted data that the curve becomes visible before they draw anything.
How to Build These Worksheets Into Your Unit Plan
These graphing parabolas printable worksheets for 9th grade fit most naturally into the independent or partner practice phase — the roughly 20 minutes after direct instruction when students move from watching to doing. The format gives struggling students enough structure to attempt the problem and enough room on the page for you to see their work at a glance as you circulate. Students who freeze on blank grids benefit from the pre-drawn coordinate planes included in most of the standard and vertex form exercises.
They also hold up well as low-stakes exit slips. A two-problem "identify and plot these features" task at the end of class tells you quickly whether students are conflating the axis of symmetry formula with the quadratic formula, or which students are ready to move from standard form to vertex form the following day. Running a vertex form worksheet as a Monday warm-up four or five days after the original lesson builds spaced retrieval into the schedule without requiring a separate review lesson — you're using ten minutes of existing class structure rather than carving out a new block.
Differentiating the Set Across Readiness Levels
Students who are still inconsistent with integer arithmetic get derailed in this unit disproportionately. A sign error in a table of values shifts the entire graph, and the student often cannot tell whether the graph looks wrong because of the calculation or because they misunderstand parabolas. For those students, starting with exercises where a equals 1, b is even, and the vertex lands on a whole-number coordinate removes the arithmetic variable and isolates the graphing concept. The introductory worksheets in the set use that parameter range deliberately.
Students who are ready to stretch benefit from exercises where the leading coefficient is greater than 1 or less than 0, requiring them to graph a narrower opening or a downward-facing parabola. A further push is asking students to work from the graph backward to the equation — identifying enough features to write the function in vertex form. Peer explanation is worth building in at this stage: a student who can articulate aloud why the axis of symmetry formula produces a positive value when b is negative has genuinely understood it, not just calculated it correctly once.
Standard Alignment
CCSS.MATH.CONTENT.HSF.IF.C.7.A requires students to graph quadratic functions showing intercepts, maxima, and minima. This standard falls in the Interpreting Functions domain and typically arrives in the second semester of Algebra 1, after linear functions and an introduction to quadratic expressions. Each worksheet in the set addresses at least one of the explicit features named in the standard — vertex as maximum or minimum value, x-intercepts, y-intercept — and asks students to record those values before or alongside the graph rather than inferring them from a sketch. Teachers working within the Illustrative Mathematics Algebra 1 sequence will find the content aligns with Unit 7, where students move from analyzing quadratic expressions to graphing and interpreting functions in context.
Frequently Asked Questions
Do the worksheets include pre-drawn coordinate planes?
Most of the graphing exercises include coordinate grids already scaled for the equations given, so students are not spending instructional time on axis setup. A subset of the higher-level exercises uses blank grids intentionally — choosing an appropriate scale for a given function is part of the task in those cases.
How long does a typical worksheet take during class?
For on-grade-level students, most worksheets run 15 to 20 minutes when the table of values is left blank and closer to 10 to 12 minutes when it is partially pre-filled. Teachers who use them as exit slips typically assign two or three featured problems rather than the full exercise.
Are applied problems included alongside pure equation practice?
Several worksheets present context problems — a projectile's height over time, the arch of a cable bridge, a revenue curve for a small business — where students interpret the vertex as a maximum height or maximum profit rather than just a coordinate pair. These problems consistently generate more discussion than the equation-only exercises and are worth assigning before any unit assessment that includes applied items. These graphing parabolas printable worksheets for 9th grade are not limited to procedural practice; the applied problems require students to explain what the key features mean within the situation, not simply locate them on the graph.














 Interactive Worksheet Maker
 Quiz Maker
 Word Search Maker
 Crossword Puzzle Maker
 Word Scramble Generator
 Sentence Scramble Generator
 Handwriting Worksheet Generator
 Name Tracing Generator
 Fill In The Blank Generator




 BACK TOSCHOOL