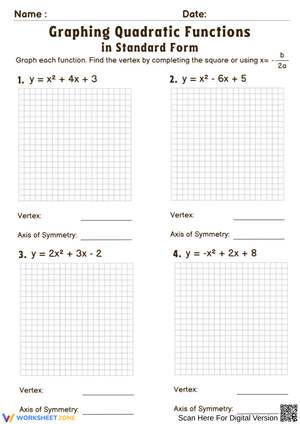
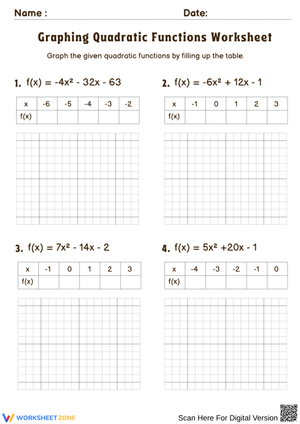
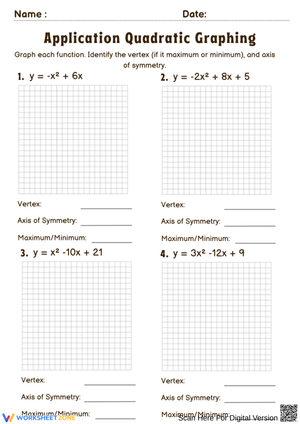
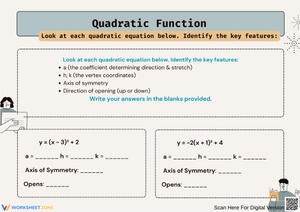
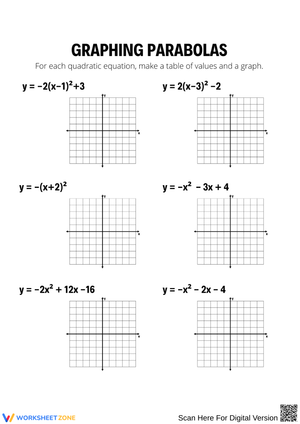
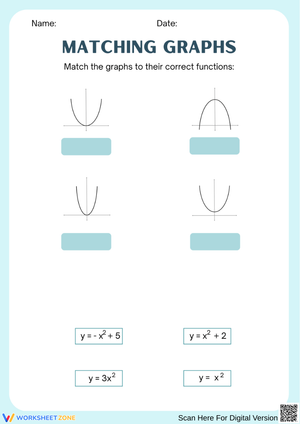
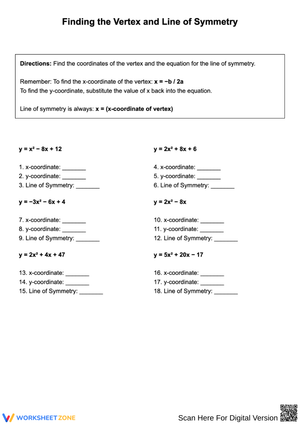
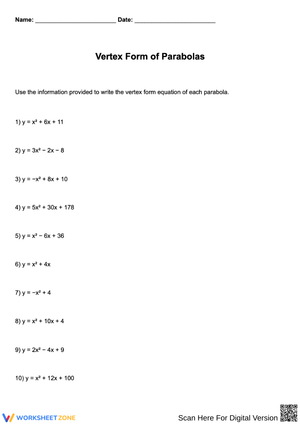
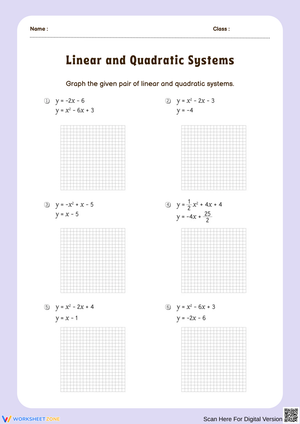
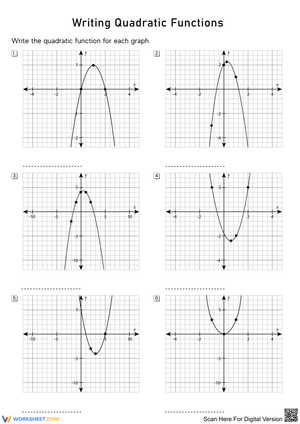
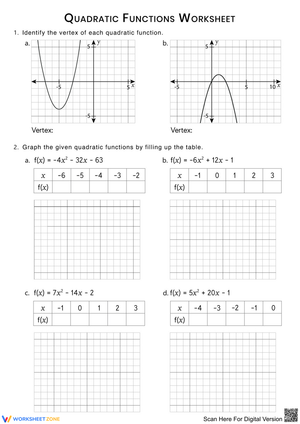
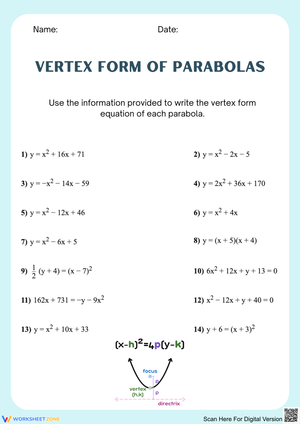
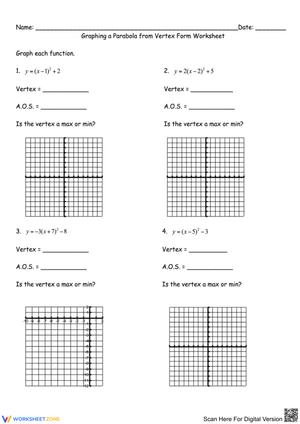
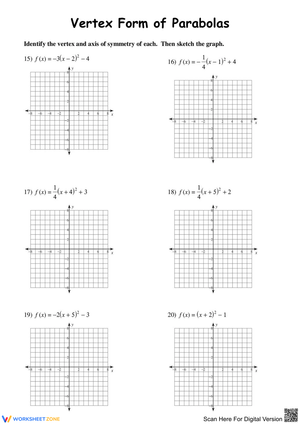
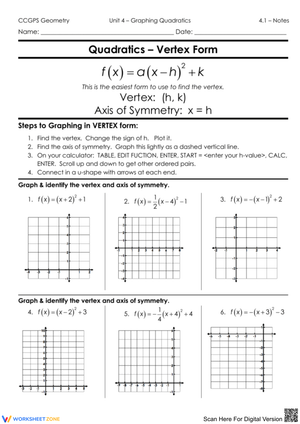
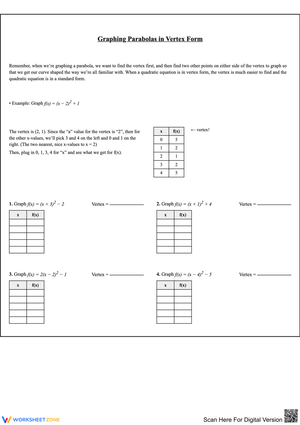
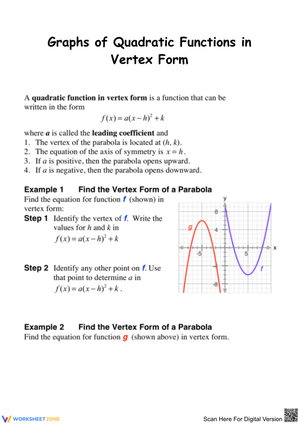
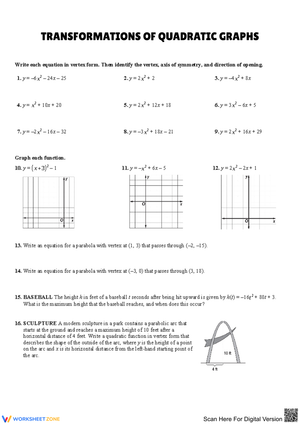
These graphing quadratic functions worksheets for 9th grade give algebra teachers targeted, printable practice built around the most disorienting shift in the Grade 9 math year — the move from linear to non-linear functions. Each worksheet focuses on one component of that transition, so students aren't trying to absorb vertex form, axis-of-symmetry calculations, and parabola direction all in the same exercise. The set covers the full arc of parabola analysis: reading key features from a graph, working from an equation to a sketch, and converting between standard and vertex form.
The Specific Skills Targeted Across the Set
Because each worksheet stands alone, teachers can pull exactly what the class needs — the vertex-and-intercepts worksheet on Tuesday and the form-conversion worksheet three days later — without moving through the full set in order. Here is what the set covers:
- Vertex identification — students locate the vertex from both graphed parabolas and written equations, recording it as a coordinate pair before touching the grid.
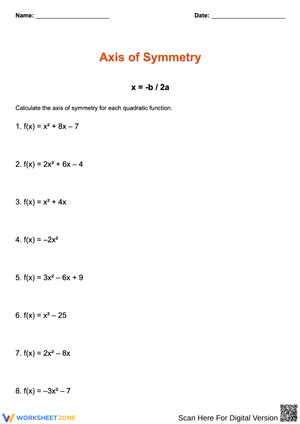
- Axis of symmetry — writing the axis in x = k form and using it to check plotted points for balance on both sides.
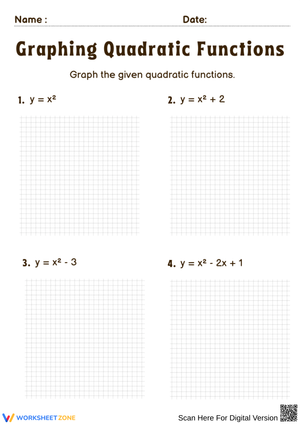
- Standard form graphing — applying x = -b/2a to find the vertex x-coordinate, substituting back into the equation to find y, then plotting from there outward.
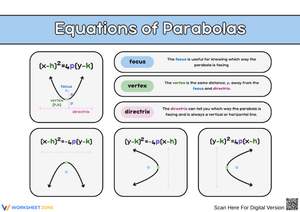
- Vertex form reading — interpreting h and k as horizontal and vertical shifts from the parent function and matching equations to pre-drawn parabolas.
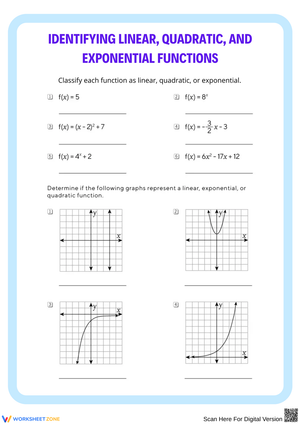
- Leading coefficient analysis — predicting direction of opening and relative width before plotting, then verifying that prediction with a table of values.
- Completing the square — rewriting standard form equations in vertex form, which bridges algebraic manipulation and graphical interpretation in one exercise.
Frequent Student Errors Worth Watching For
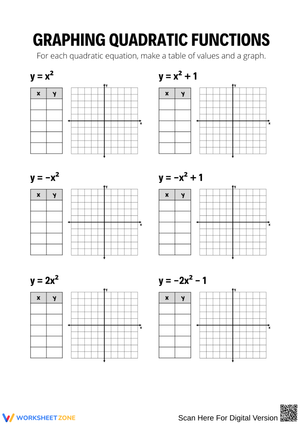
The most persistent mistake when students first graph quadratics is treating the vertex as a starting point and then choosing x-values in only one direction. A student will correctly find the vertex of y = x² - 4x + 3 at (2, -1) and then build a table using x = 3, 4, and 5 — producing a lopsided right branch with nothing plotted to the left. The table-of-values worksheets in this set require students to record x-values both above and below the vertex before touching the coordinate plane, which turns the symmetric structure into a procedural habit rather than something students remember only when reminded.
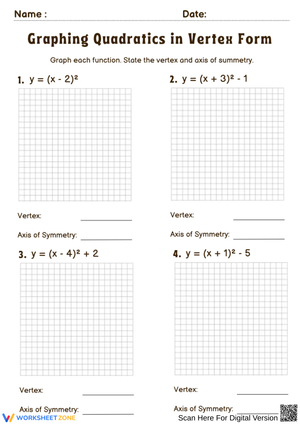
A second error pattern shows up specifically with vertex form. When a function is written as y = (x - 3)², students routinely read the vertex as (-3, 0) instead of (3, 0). The subtraction inside the parentheses reads intuitively as a negative, and most 9th graders who haven't fully internalized transformation logic will make this mistake at least once. Most graphing quadratic functions worksheets for 9th grade that present vertex form without a structured check on sign interpretation actually accelerate this error by moving students immediately to plotting. The vertex-form worksheet in this set adds a column asking students to write the vertex as a coordinate pair before graphing, making the sign decision a discrete visible step where the mistake can surface and be corrected before it propagates into the sketch.
A third pattern: students correctly calculate x = -b/2a in standard form and then stop, forgetting to substitute back to find the y-coordinate. In actual student work, this shows up as a vertex marker that sits noticeably off the curve the student drew. The structured row format on the standard-form worksheet includes a dedicated line for the substitution step, which makes skipping it visually obvious at a glance.
How to Work These Worksheets Into Your Unit Plan
The table-of-values worksheet belongs early — ideally the day after students first see the parent function y = x². Having them build a nine-row table centered on x = 0, plot the result, and draw the axis of symmetry as a dashed vertical line gives them a concrete visual anchor for every transformation lesson that follows. The axis-of-symmetry worksheet fits naturally at the transition point between that initial graph and the formula x = -b/2a, because it asks students to draw the symmetry line on pre-plotted parabolas before they've seen the algebraic shortcut — which creates motivation for the formula rather than presenting it cold.
For class periods built around direct instruction followed by independent practice, the most reliable sequence for these graphing quadratic functions worksheets for 9th grade runs something like this: ten minutes of whole-group instruction on the target skill, twenty minutes on the worksheet, then a five-minute whole-class check where two or three students put their coordinate grids on the board. That final step catches arithmetic errors a standard answer-key comparison wouldn't surface — an asymmetric parabola is immediately visible to a room full of students even when the underlying calculation error is subtle.
The completing-the-square worksheet belongs near the end of the unit. Teachers often use it as a formative check the day before a summative assessment because it reveals in one worksheet whether students can manage the algebraic manipulation, interpret the resulting vertex form visually, and produce an accurate graph — three connected skills that a single multi-problem test question rarely isolates as cleanly.
Standard Alignment
These worksheets address CCSS.MATH.CONTENT.HSF.IF.C.7a, which requires students to graph quadratic functions and identify intercepts, maxima, and minima. They also support CCSS.MATH.CONTENT.HSF.IF.B.4, focused on interpreting key features — vertex, direction of opening, and intervals of increase and decrease — from both equations and graphs. In classroom terms, these two standards mark the place in Algebra I where graphing stops being a mechanical point-plotting exercise and starts requiring students to read mathematical structure into the curves they draw. Both standards appear on most state end-of-course algebra assessments, making the skills practiced here directly testable.
Adjusting the Set for a Range of Learners
Students who need more support work most successfully with the table-of-values worksheets. The step-by-step format reduces the number of decisions a student has to hold in working memory at once by breaking graphing into a series of arithmetic operations. Providing a reference card with the vertex formula and a worked example of the vertex-form sign rule gives these students enough of a support structure to access the skill without requiring the teacher to re-explain the same concept individually at five different desks during the work period.
For students moving through the material quickly, the completing-the-square worksheet and the leading-coefficient analysis worksheet both carry enough depth to stay challenging. A natural extension on the vertex-form worksheet: cover the equation and ask the student to write it from the graph alone. That reversal — deriving the equation from a drawn parabola rather than graphing a given equation — demands a more thorough understanding of what each parameter controls. These graphing quadratic functions worksheets for 9th grade include enough pre-drawn graphs to support that extension without any additional preparation on the teacher's part.
Frequently Asked Questions
Which worksheet should I use first when introducing parabolas?
Start with the table-of-values worksheet using the parent function y = x². Keeping the equation simple lets students focus entirely on the graphing process — building a symmetric table, plotting points, and recognizing the U-shape — before transformations complicate the picture. Everything else in the set builds on that first visual reference.
Can any of these worksheets function as a formative assessment?
The standard-form graphing worksheet and the axis-of-symmetry worksheet both work well as quick formative checks. They take most 9th graders between 15 and 20 minutes to complete, which fits the last segment of most class periods. The completing-the-square worksheet is better reserved for a pre-test or end-of-unit review because it draws on multiple connected skills at once rather than isolating one.
What if a student plots the vertex correctly but draws a parabola with the wrong shape?
That is almost always a leading coefficient issue. The student found the vertex accurately but either ignored the value of a entirely — drawing a default-width parabola regardless of what the equation says — or misread its sign and opened the parabola in the wrong direction. The leading-coefficient analysis worksheet targets this directly: it presents three parabolas with the same vertex but different a values and asks students to compare them before writing the corresponding equations. Isolating that single variable makes its effect on shape visible in a way that a verbal explanation typically does not.
Do the worksheets include answer keys?
Yes. Each worksheet comes with a corresponding answer key showing the completed coordinate grid alongside written answers for vertex, axis of symmetry, and intercepts. The graphed key is particularly useful for the table-of-values worksheets — a student can set their own grid next to it and see exactly where their parabola diverges from the correct solution, which makes self-correction more precise than comparing a column of numerical answers.














 Interactive Worksheet Maker
 Quiz Maker
 Word Search Maker
 Crossword Puzzle Maker
 Word Scramble Generator
 Sentence Scramble Generator
 Handwriting Worksheet Generator
 Name Tracing Generator
 Fill In The Blank Generator




 BACK TOSCHOOL