7th Grade Limiting Factors Printable Worksheets
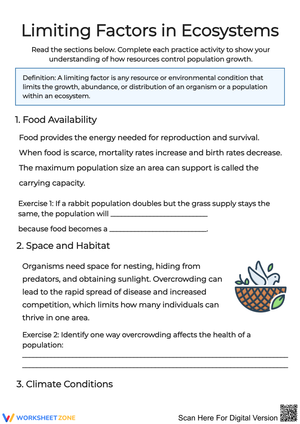
These 7th grade limiting factors worksheets give students structured practice with one of the trickier population ecology concepts in middle school science — the idea that environments set hard ceilings on growth, and that those ceilings are built from multiple interacting variables operating at the same time. Each worksheet targets a distinct piece of that picture: identifying biotic and abiotic constraints, reading population graphs, distinguishing density-dependent from density-independent effects, and connecting all of it to the carrying capacity model that anchors the unit.
What's Inside the Set
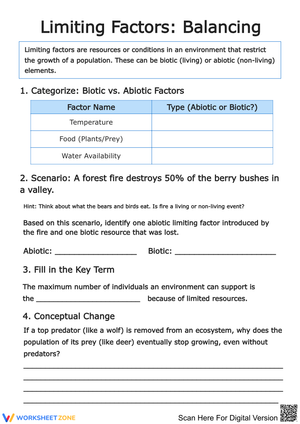
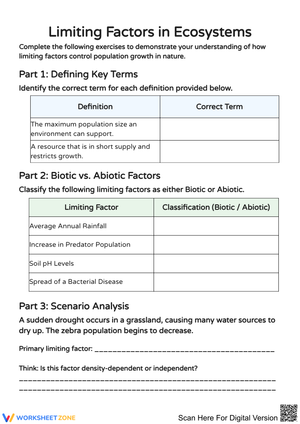
The worksheets move students through the concept in deliberate sequence. Early worksheets focus on classification — students sort a list of conditions (predation pressure, soil nitrogen, drought, disease spread, temperature drop) into biotic and abiotic columns, then annotate a sample ecosystem diagram to show where each factor operates. That sorting work matters because students who can't make the biotic/abiotic distinction reliably will misread every graph question that follows.
Later worksheets shift to analysis. Students interpret S-curve and J-curve graphs, mark the carrying capacity line, and answer scenario questions: what happens to a deer population if a hard winter reduces available forage? What changes when a new competitor enters the same food web? One worksheet presents a case study using wolf reintroduction in the Northern Rockies — students trace how a single biotic variable propagated changes through multiple trophic levels. Another uses drought data to illustrate how an abiotic, density-independent event can collapse a population regardless of its prior size or health.
Across the set, question formats vary intentionally. Students label diagrams, complete data tables, write short explanations, and choose among multiple-choice scenarios. That variety forces them to use vocabulary in more than one context — which is the only way to know whether they actually own a term like "density-dependent" or are just pattern-matching it to the right sentence.
Standard Alignment
These worksheets are aligned to NGSS MS-LS2-1, which asks students to analyze and interpret data to provide evidence for the effects of resource availability on organisms and populations in an ecosystem. In instructional terms, this standard lives in the middle of a population ecology unit — after students can identify ecosystem components but before they tackle food web dynamics and energy flow. The graph interpretation and scenario analysis questions on these worksheets directly address the "analyze and interpret data" science practice embedded in MS-LS2-1, not just the disciplinary core idea. Students are not simply identifying terms; they are using population data to construct evidence-based claims, which is the performance the standard actually assesses.
Mistakes Students Make That These Worksheets Help You Catch
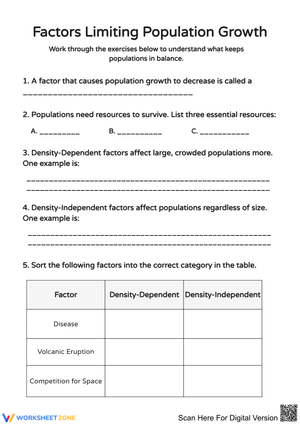
The most persistent error is treating limiting factors as a ranked list rather than a simultaneous web. Students will write that a pond ecosystem's limiting factor is "sunlight" — as if identifying one variable closes the question. A worksheet question that asks students to identify three concurrent limiting factors in the same scenario and explain how they interact directly breaks that single-cause thinking.
A second consistent problem shows up with carrying capacity graphs. Students read the plateau of an S-curve as "the population stopped growing" and go no further. They do not connect the plateau to the ongoing pressure of limiting factors — in their mental model, the population simply ran out of momentum. Questions that ask them to draw what happens when a new food competitor is introduced, or when a drought temporarily drops the line below carrying capacity, force them to treat the plateau as dynamic rather than fixed.
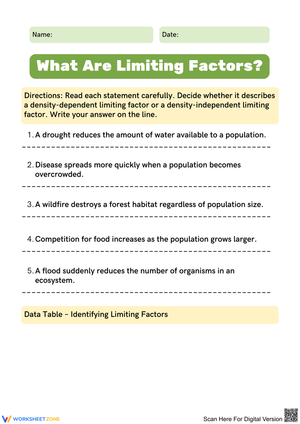
The density-dependent/density-independent distinction also produces reliable confusion. Students understand that a wildfire kills animals; they struggle to articulate why that makes wildfire density-independent. A worked example that contrasts disease spread (which accelerates as population density rises) against a flood (which kills the same proportion regardless of crowd size) tends to be the moment the distinction clicks. The worksheets build that contrast explicitly.
How to Build These Worksheets Into Your Lesson Plans
The classification and sorting worksheets work well as guided practice the day after you introduce the biotic/abiotic distinction — give students ten minutes to work independently, then spend another ten on whole-class discussion of the edge cases. (Parasites and bacteria generate productive argument: are they biotic factors or disease agents? Both, and the conversation is worth having.)
The graph-based worksheets are best deployed during a 20-25 minute block where students have already seen a teacher-modeled example. Cold-starting students on an S-curve without a reference example produces a lot of frozen pencils and off-task behavior. Show one graph together, narrate your thinking aloud, then release them to the worksheet version. Save the scenario extensions — the "what happens if" questions — for the last five minutes as an exit task or for the following day's warm-up. Monday morning review of a Friday graph question, with students explaining their reasoning to a partner, gives you a fast formative read on who consolidated the concept over the weekend and who needs a reteach loop.
The wolf/elk case study worksheet pairs naturally with a short video clip if you have the time. Without video, it still stands alone — the background text on the worksheet carries enough context.
Adjusting the Worksheets for a Range of Learners
For students who need more support, the sorting and classification worksheets can be scaffolded by providing a word bank or a partially completed anchor chart on the biotic/abiotic distinction. On graph worksheets, marking the axes and labeling the carrying capacity line before students begin reduces the cognitive load enough that struggling readers can focus on the ecological reasoning rather than the mechanics of graph reading.
For students who move through the material quickly, the scenario-based questions offer natural extension: ask them to design a hypothetical ecosystem, specify its limiting factors, and sketch the expected population curve with a written justification. That task requires synthesis across everything the unit covers and produces work that is easy to assess for depth of understanding. The wolf/elk case study also lends itself to extension — students can research what actually happened to elk grazing behavior after wolf reintroduction and evaluate whether the worksheet scenario matched the real data.
Frequently Asked Questions
How do these worksheets address MS-LS2-1 beyond vocabulary recognition?
MS-LS2-1 requires students to analyze and interpret data as the primary science practice — not just define terms. The graph worksheets ask students to read population data, identify inflection points, and explain what limiting factor likely caused a observed change. That's the standard's performance expectation in practice. Vocabulary matching alone does not satisfy it.
What is the practical difference between a limiting factor and carrying capacity, and how do the worksheets treat that distinction?
Limiting factors are the specific variables — food scarcity, predation rate, drought — that prevent a population from growing beyond a certain point. Carrying capacity is the population size that results when those factors are in balance with available resources. The worksheets treat them as cause and effect: students identify the limiting factors in a scenario first, then determine or graph the resulting carrying capacity. Reversing that order is one of the errors the sequence is designed to prevent.
Can a single ecosystem scenario involve multiple limiting factors operating at the same time, and do the worksheets reflect that?
Yes, and this is one of the more important things the worksheets address explicitly. A riparian plant community might face simultaneous pressure from low soil nitrogen, browse by deer, and reduced snowmelt reducing late-season water availability — all three active at once, with different intensities across seasons. Several worksheet scenarios present exactly that kind of multi-factor situation and ask students to rank or explain which factor is most constraining under specific conditions, which pushes beyond simple identification toward ecological reasoning.
Are these worksheets appropriate as a summative assessment or primarily for formative use?
Most worksheets in the set work best as formative practice — they are instructional tools designed to surface misunderstanding mid-unit so you can address it before a test. The case study and scenario-extension worksheets, however, produce written explanations substantive enough to score as a performance task if you need a grade. Pairing one of those with a clear analytic rubric gives you a defensible summative measure tied directly to MS-LS2-1.
Clear All