7th Grade Drawing Inferences from Samples Worksheets
These 7th grade drawing inferences from samples worksheets give students structured practice at exactly the point in the curriculum where abstract statistical reasoning starts to matter — proportional estimates, random vs. biased samples, and the uncomfortable truth that every inference carries uncertainty. Each worksheet targets a distinct skill within the 7.SP.A domain so you can assign them precisely instead of handing students a grab-bag of mixed practice.
What's Inside the Set
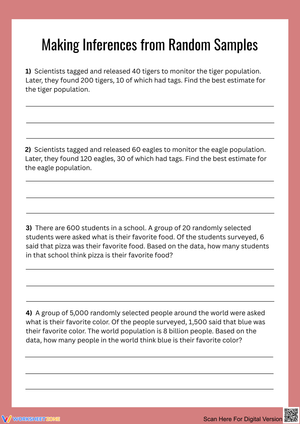
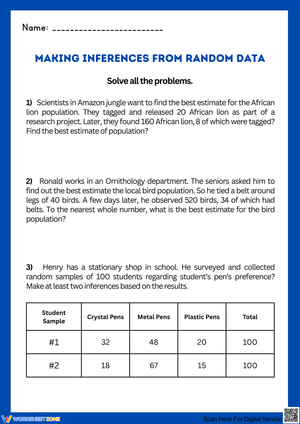
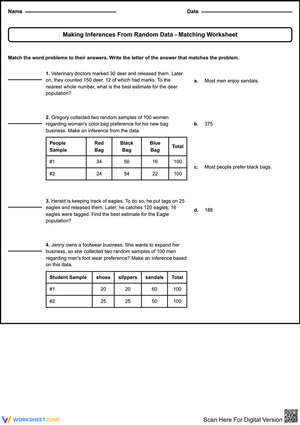
The worksheets cover the full arc of sample-based reasoning that seventh graders need: identifying whether a described sampling method is random or biased, using proportions to scale sample results to population estimates, comparing multiple samples from the same population to observe variability, and evaluating the validity of a stated inference. Students underline key information in word problems, set up equivalent ratios with labeled terms, cross-multiply to solve for an unknown population count, and annotate whether a sampling scenario would produce a reliable estimate. The scenarios rotate through contexts that land well with this age group — school preference surveys, fish-population studies in a lake, and factory quality-control counts — so the same mathematical structure appears in enough different settings that students start to recognize the pattern rather than memorize a single procedure.
Standard Alignment
These worksheets address CCSS.Math.Content.7.SP.A.1 and 7.SP.A.2 directly. 7.SP.A.1 establishes that students must understand what makes a sample random and recognize sampling bias — the worksheets targeting bias identification and random-sample evaluation address this standard. 7.SP.A.2 requires students to use data from a random sample to draw inferences about a population and to generate multiple samples of the same size to gauge variation in estimates — the proportion-based population estimate problems and the multi-sample variability worksheets address this standard. Within a typical 7th grade year, this cluster follows the ratio and proportion unit and precedes the probability unit, which means students arrive with the mathematical machinery they need and leave ready to reason about likelihood with a cleaner sense of what "estimate" means.
Frequent Student Errors Worth Watching For
The most persistent error is setting up the proportion with mismatched units — placing the sample size in the denominator of one ratio and the population size in the numerator of the other. Students who do this still cross-multiply and get a number, which means the error survives unchecked unless you require labeled ratios. Asking students to write favorable in sample / total in sample = favorable in population / total in population before they fill in any values catches this more reliably than reminding them to "check their setup."
A second error appears specifically in the bias-identification problems. Students learn quickly that "surveying only your friends" is biased, but they struggle with subtler exclusions. A worksheet scenario that describes a school survey conducted during a Tuesday morning elective period consistently trips students up — they mark it random because the school setting feels neutral, without noticing that students in that elective are a self-selected group. These are the scenarios worth pausing on during class review, because the reasoning students need to articulate there is exactly what 7.SP.A.1 is targeting.
Students also conflate "the sample result" with "the population estimate." After calculating that approximately 320 students prefer outdoor recess, some will write their final answer as 20 (the sample count) or will describe their estimate as exact rather than approximate. Building in a final sentence prompt — "Based on this sample, I estimate that about ___ out of ___ students in the population ___, though this is an estimate because ___" — closes that gap faster than re-teaching the concept.
Building These Worksheets Into Your Lesson Plans
The bias-identification worksheets work well as Monday warm-ups before the week's core instruction, since reading and evaluating a scenario takes about eight minutes and primes students for the proportional work that follows. Save the multi-sample variability worksheets for after students have solid proportion fluency — those problems require students to calculate three separate estimates and then draw a conclusion about the range, which becomes frustrating rather than illuminating if the arithmetic is still shaky.
For the population estimate worksheets, a gradual release structure pays off here more than in most 7th grade math units. Students who jump directly to independent practice tend to produce correct answers through memorized steps without understanding what the proportion represents. Spending ten minutes doing one problem together on a whiteboard — narrating every decision aloud, including why you put the sample total in that position — consistently produces better transfer to the independent problems than assigning two worked examples to read silently.
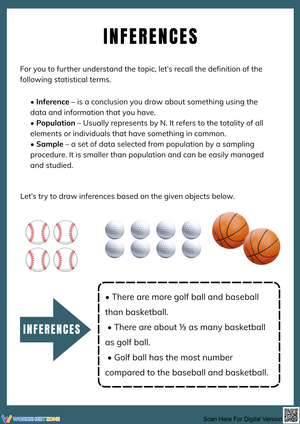
These worksheets also fit naturally into a simulation-first lesson sequence. Have student groups draw twenty-item samples from a bag of mixed objects, calculate a proportion, make a population estimate, and record it on the board. Once six or seven groups have posted different estimates from the same bag, hand out the variability worksheet. Students move from a concrete experience of variability to a formalized written practice of it within the same class period, which reduces the conceptual friction considerably.
Frequently Asked Questions
Do students need to know proportions before using these worksheets?
Yes. Students should be comfortable setting up and solving equivalent ratios before working through the population estimate worksheets. The statistical reasoning is the new load here; students who are still uncertain about cross-multiplication will conflate the two difficulties. The bias-identification worksheets require no proportion calculations and can be used earlier in the unit while proportion fluency is still developing.
How many samples does 7.SP.A.2 expect students to generate?
The standard says "multiple samples of the same size" without specifying a number. In practice, three samples is enough to let students see meaningful variation without the lesson becoming a data-collection marathon. The multi-sample worksheets use three-sample sets for this reason — the comparison is visible and the arithmetic stays manageable within a single class period.
Can these worksheets be used as a quiz or formative assessment?
Several worksheets in the set work well as exit tickets or short formative checks, particularly the single-scenario problems that ask students to identify sampling method, set up a proportion, calculate an estimate, and evaluate the inference in four discrete steps. That format gives you a clear picture of exactly where a student's reasoning breaks down rather than just whether the final answer is correct.
What's the best way to handle the "biased vs. random" problems when students disagree?
Disagreement on those problems is usually a sign the scenario is doing its job. Rather than adjudicating immediately, ask students to identify the specific segment of the population the sampling method would exclude. If they can name it — "students who don't use social media," "families without a car" — they have the reasoning they need to reach a conclusion themselves. The worksheets include a line for students to write out that exclusion, which structures the argument without short-circuiting it.
Clear All