These 7th grade population and sample worksheets give students structured, varied practice with one of the more conceptually demanding pivots in middle school math — moving from describing data they can see to drawing conclusions about data they cannot. Each worksheet presents real-world survey scenarios where students identify the population and sample, evaluate the fairness of the sampling method, and decide whether any inference drawn from the data holds up.
Skills These Worksheets Build
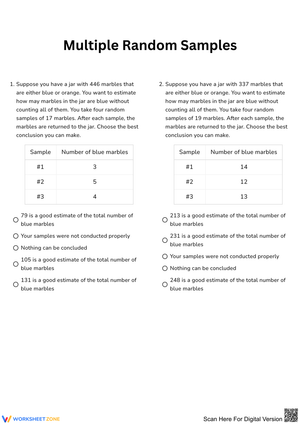
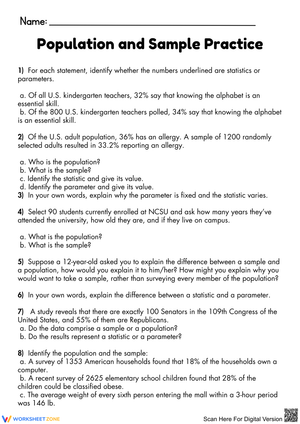
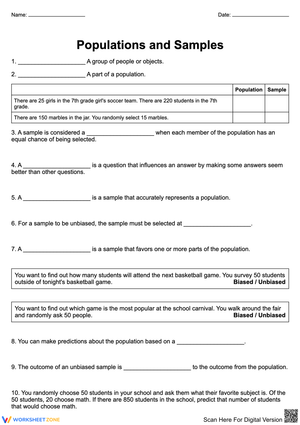
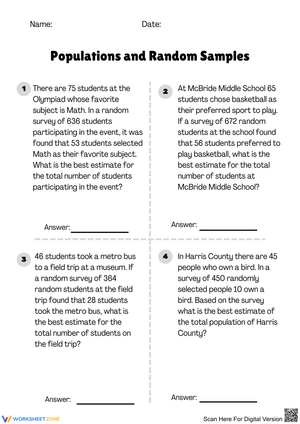
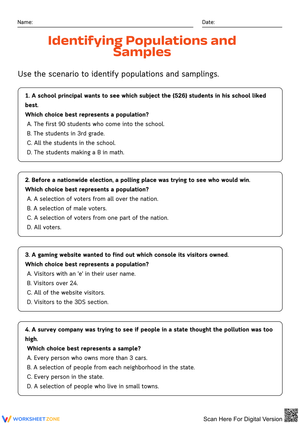
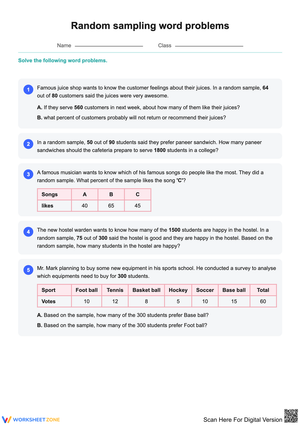
The core work across the set is identifying population versus sample in word problems — a task that sounds straightforward until students meet scenarios where the distinction is deliberately blurry. Beyond that initial identification, students evaluate sampling methods for bias, explain in writing why a given method is or isn't representative, and calculate population estimates using proportional reasoning from sample data. That last skill connects directly to the ratio and proportion work students did in 6th grade, which helps teachers anchor the new statistical thinking to something already in students' toolkit.
Several worksheets focus specifically on bias: convenience sampling, voluntary response sampling, and the subtler problem of a sample that is too narrow even when selected randomly. Students mark whether a described method is biased, identify which part of the population is over- or underrepresented, and rewrite the sampling procedure to make it fairer. A few exercises ask students to design their own survey question and sampling method for a given scenario, then justify their choices — the kind of open-ended task that reveals whether a student genuinely understands representativeness or has just memorized definitions.
Standard Alignment
These worksheets address CCSS.MATH.CONTENT.7.SP.A.1, which requires students to understand that statistics can be used to gain information about a population by examining a representative sample, and that valid generalizations depend on the sample being representative of the population. In classroom terms, this standard sits at the front of the 7th grade statistics unit and provides the conceptual foundation for 7.SP.A.2, where students use data from random samples to draw inferences and compare populations. Teachers who work through the identification and bias worksheets first, then move to inference and estimation, will find the transition to 7.SP.A.2 considerably smoother because students have already built the critical vocabulary and reasoning habits the second standard assumes.
Mistakes Students Make That These Worksheets Help You Catch
The most persistent error at this level is conflating sample size with sample quality. Students consistently assume that a larger sample is automatically more reliable, which leads them to mark a 500-person convenience sample as "better" than a 30-person random sample. This misconception shows up in written justifications too — a student will write "500 people is a lot, so the results are trustworthy" without addressing how those 500 people were chosen. The worksheets include several direct comparisons between large biased samples and small random ones, which forces students to confront that logic explicitly.
A second pattern: when students identify bias, they often point to the wrong variable. If a scenario describes surveying only students who attended an after-school sports event, students will correctly flag it as biased — but they'll say it's biased because "not everyone likes sports," which misses the point. The actual problem is that students who stay after school for a voluntary activity are not randomly distributed across the school population in terms of schedule, parent pickup arrangements, participation in other programs, and so on. Getting students to articulate the mechanism of bias, not just the surface observation, takes deliberate practice and the worksheets push on that specifically.
How to Build These Worksheets Into Your Lesson Plans
The identification worksheets — those focused purely on labeling population and sample — work well as bell-ringers during the first three days of the unit, before students have fully absorbed the vocabulary. Three or four short word problems at the start of class give students something to argue about with a partner before instruction begins, and that low-stakes disagreement surfaces conceptual confusion earlier than a quiz would.
The bias-evaluation worksheets are better placed mid-lesson, after direct instruction but before independent practice. They work especially well as a turn-and-talk anchor: project one scenario, have students mark their answer individually, then compare with a partner before sharing out. The disagreements that surface — particularly on the ambiguous scenarios where a method is slightly biased but not egregiously so — generate exactly the kind of discussion the standard is asking students to have. Save the design-your-own-survey worksheets for later in the unit, either as a culminating activity or as a formative checkpoint before the end-of-unit assessment. Those tasks demand the fullest integration of all the skills in the set.
Adjusting the Worksheets for a Range of Learners
For students who struggle with the vocabulary load, the most effective modification is a two-column reference card listing population, sample, random sampling, convenience sample, voluntary response, and bias — each with a brief definition and a concrete non-math example. Pairing that card with the identification worksheets removes the working-memory pressure of holding six new terms simultaneously and lets students focus on the reasoning. Once the terms are internalized, pull the card. Students who freeze on open-ended justification prompts benefit from a sentence frame: "This sampling method is biased because it only includes _____, which means _____ members of the population are not represented."
For students who move through the material quickly, the most productive extension is asking them to find a real survey or poll — a school election, a class preference vote, a news-referenced study — and write a critique of the sampling method using the criteria from the worksheets. That task is harder than it looks because real surveys rarely come with full methodology disclosed, and deciding whether the information given is sufficient to evaluate the sample requires genuine statistical thinking rather than pattern-matching to worksheet formats.
Frequently Asked Questions
How do students tell the difference between population and sample in a word problem?
Look for the scope of the question versus the scope of the data collection. The population is whoever or whatever the researcher wants to draw conclusions about — often signaled by "all," "every," or a total count given without qualification. The sample is the specific group actually measured or surveyed, usually described with a number smaller than the population total. In ambiguous problems, a useful prompt is: "Who does the researcher want to make a claim about?" That group is the population, regardless of how many people were actually asked.
What's the difference between a biased sample and a small sample?
A biased sample systematically excludes or overrepresents part of the population due to the method used — the problem is in how individuals were selected, not how many. A small sample introduces more variability, meaning the results are less stable, but a small random sample is still unbiased. The two issues are independent, which is why students need to evaluate method and size separately. These worksheets treat them as separate questions: first, is the method sound? Second, is the sample large enough to be informative?
Are these worksheets appropriate for use as a formal assessment?
The identification and bias-evaluation worksheets work well as formative checkpoints during the unit. The open-ended design and justification tasks are better suited for summative assessment of 7.SP.A.1 because they require students to produce reasoning, not just select an answer. If you're using these as a graded assessment, the written justification prompts are the most diagnostically useful pieces — they show whether students understand why a sampling method produces reliable or unreliable data, which is the actual goal of the standard.
Do these worksheets connect to anything students have already learned?
Yes, and making that connection explicit helps students engage. The population-to-sample inference problems draw directly on 6th grade ratio and proportion skills: if a random sample shows a certain percentage, students scale that proportion to the full population using the same mechanics they applied to unit rates and equivalent ratios. Framing it that way — "you already know how to do the math, now you're applying it to a new kind of question" — reduces the anxiety that sometimes comes with statistics vocabulary and helps students see the continuity in what they're learning.