Graphing Sine and Cosine Functions Printable Worksheets for 11th Grade
These graphing sine and cosine functions printable worksheets for 11th grade give Precalculus and Algebra 2 teachers a sequenced set of resources built around the most analytically demanding unit in the high school trig curriculum. Each worksheet targets a distinct layer of the transformation process — amplitude, period, phase shift, vertical shift — so students build the mental model incrementally rather than absorbing four variables at once.
The Specific Skills Targeted
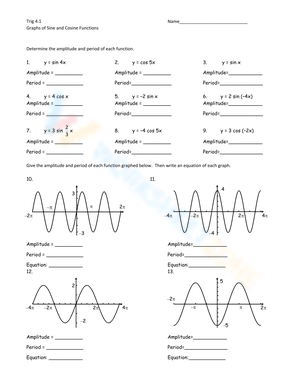
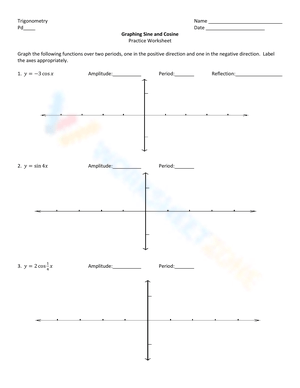
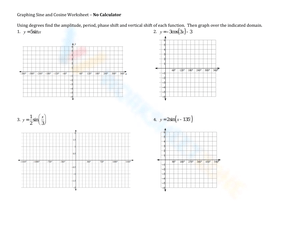
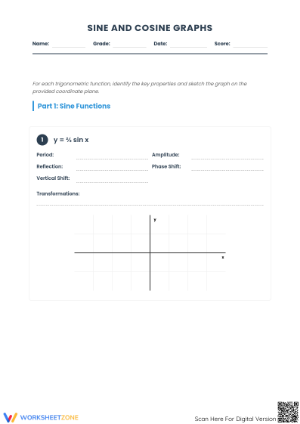
Students work with the general forms y = a·sin(bx + c) + d and y = a·cos(bx + c) + d. Before sketching a single curve, they extract all four parameters from the equation — amplitude (|a|), period (2π/|b|), phase shift (−c/b), and vertical shift (d) — and record them in a parameter analysis table. From there, they identify the midline, plot the five key points of one complete cycle, and sketch the curve. Later worksheets in the set ask students to work in reverse: given a graph, write the equation.
The set also includes matching tasks where students pair equations to pre-drawn graphs. That format tests recognition rather than construction — a meaningfully different cognitive demand. Students who can sketch a graph from scratch sometimes struggle to confirm a match quickly, and that gap shows whether understanding is procedural or conceptual.
Frequent Student Errors Worth Anticipating
Phase shift direction is the most reliable source of mistakes. Students see sin(2x + π) and call the phase shift π — wrong in both direction and magnitude. The fix is factoring: rewriting sin(2x + π) as sin(2(x + π/2)) makes the shift of π/2 units to the left immediately visible. Without that step, students who are otherwise solid on amplitude and period will place every key point incorrectly.
Period calculation causes a separate class of errors. Students frequently confuse the period with the value of b. Asked to graph y = cos(3x), a student might mark a full cycle as ending at x = 3 rather than x = 2π/3. These are two distinct misunderstandings — one arithmetic (dividing 2π by b), the other conceptual (understanding what period means geometrically). The worksheets address both by requiring students to write out the period formula and solve it before plotting a single point.
A subtler error appears with negative amplitude. Students who correctly sketch y = 2sin(x) will often graph y = −2sin(x) identically, forgetting the reflection across the midline. Since the reflected version starts by descending from the midline rather than ascending, the mistake appears at the very first key point — which makes it easier to catch during a quick circulate than errors that accumulate midway through a sketch.
Building These Worksheets Into Your Lesson Plans
The most effective sequence is to treat the first two worksheets — parent sine and parent cosine on pre-labeled π-based grids — as whole-class instruction pieces done with teacher modeling. Students label the five key points together: the start, the quarter-cycle peak or trough, the midline crossing, the three-quarter-cycle trough or peak, and the return. Once students have annotated those points on both parent graphs by hand, the transformation worksheets run well as independent or paired practice.
The parameter analysis table on each worksheet functions as a self-check before graphing begins. Teachers who circulate during table-filling catch most errors before students pick up a pencil to sketch. Five minutes of table review prevents twenty minutes of erasing.
Matching worksheets work well as warm-ups the morning after new transformation content — they take about eight minutes and surface confusion before a lesson moves forward. The equation-from-graph worksheets are best held until students have practiced sketching extensively; they make strong end-of-unit checks because they require students to read graphs analytically rather than follow a procedure.
Standard Alignment
Two CCSS standards from the HSF domain anchor this content. HSF-IF.C.7e asks students to graph trigonometric functions showing period, midline, and amplitude — the core task across the sketching and analysis worksheets in this set. HSF-TF.B.5 requires students to choose and interpret trigonometric functions as models for periodic phenomena, which the word-problem worksheets address directly. These graphing sine and cosine functions printable worksheets for 11th grade fit the pacing of either Precalculus or an accelerated Algebra 2 course where trig functions appear late in the year.
Adjusting the Worksheets for a Range of Learners
Students who are still shaky on unit circle values will stall during graphing because they cannot place key points at the correct x-coordinates. Allowing a unit circle reference card removes that prerequisite bottleneck and keeps the focus on transformation logic — the actual 11th-grade skill being assessed. Pulling the reference later, once graphing feels automatic, works better than withholding it from the start.
For students who move quickly, the reverse-direction worksheets — writing equations from graphs — add meaningful challenge without requiring entirely new materials. A further extension: present two sinusoidal graphs on the same axes and ask students to write equations for both, then determine the x-values where the curves intersect. That task connects trig graphing to systems thinking and previews calculus-level analysis.
Students who struggle with open grid formats benefit from worksheets where the x-axis already carries labels in multiples of π/4. The pre-labeled axis reduces setup errors and keeps cognitive load on the transformation itself. These graphing sine and cosine functions printable worksheets for 11th grade include both grid formats — labeled and blank — so teachers can assign the supported version first and shift to the open grid as fluency develops.
Frequently Asked Questions
How is the cosine graph different from sine in classroom practice?
The sine function crosses the midline at x = 0 and rises first; the cosine function starts at its maximum when x = 0 and descends. Every other transformation rule — amplitude, period, phase shift, vertical shift — applies identically to both. A cosine graph is equivalent to a sine graph shifted left by π/2. In practice, students find cosine slightly more confusing at first because the starting position (a maximum rather than a zero) does not match their intuition about where a cycle begins.
What prerequisite knowledge do students need before starting these worksheets?
Fluency with the unit circle in both degrees and radians is the critical prerequisite. Students also need to be comfortable with function notation and understand period as a horizontal measurement, not a y-value. The parent graph worksheets in this set work even for students with shaky unit circle recall — provided teachers offer reference support initially — but students who cannot identify sin(π/2) or cos(π) from memory will need that gap addressed alongside the graphing practice.
Do these worksheets work for Algebra 2, or are they Precalculus-specific?
Both. The sequenced format — parent functions first, then isolated transformations, then combined — fits either course. In Algebra 2, teachers typically spend more time on the early worksheets and may not reach the combined-transformation or equation-from-graph tasks within the same unit. In Precalculus, the full set usually fits within two to three weeks. These graphing sine and cosine functions printable worksheets for 11th grade are organized by skill level rather than course name, so teachers can assign selectively based on where their students are at any point in the year.
Clear All