These economics worksheets printable for 10th grade cover the full range of topics in a standard US high school economics course — opportunity cost and scarcity, supply and demand graph analysis, market structures, macroeconomic indicators, fiscal and monetary policy, international trade, and personal finance. Each worksheet operates as a standalone activity, so teachers can drop them into warm-up blocks, guided practice, or homework rotations without redesigning an existing unit plan.
Topics and Exercise Types Across the Set
The set spans both micro and macroeconomic content, and the exercise format matches the type of thinking each topic demands. You wouldn't hand a graph-plotting task to students encountering new vocabulary for the first time, and a simple matching exercise won't build the analytical work a comparative advantage problem requires. Each worksheet type earns its place by targeting a specific reasoning skill.
- Opportunity cost and scarcity scenarios — Students identify trade-offs within real decisions and calculate opportunity cost using production possibilities data.
- Supply and demand graph analysis — Students label axes, plot supply and demand curves, identify equilibrium, and explain in writing what happens to price and quantity when one curve shifts.
- Market structure comparison charts — Side-by-side organizers help students distinguish perfect competition, monopoly, oligopoly, and monopolistic competition by number of sellers, pricing power, and product differentiation.
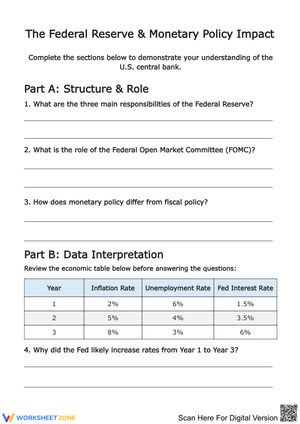
- Macroeconomic data tables — Students read GDP growth rates, CPI figures, and unemployment statistics, then answer guided questions that require interpreting trends rather than restating numbers.
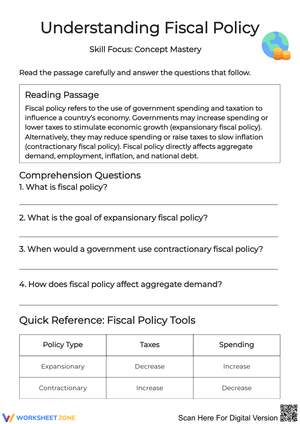
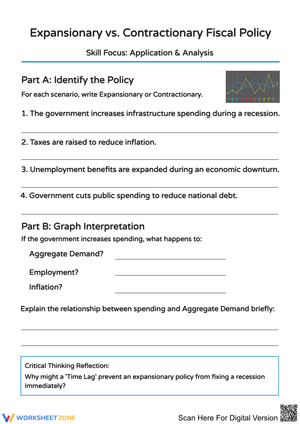
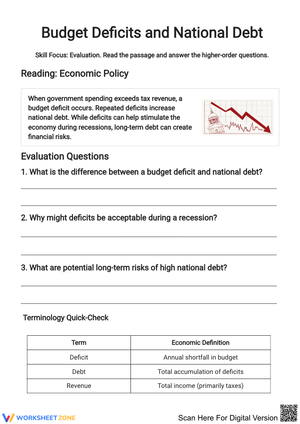
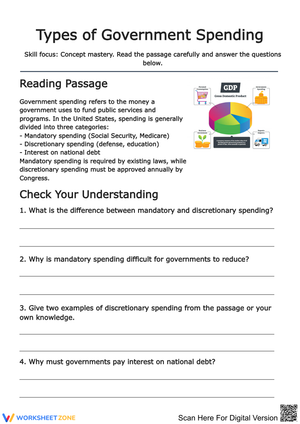
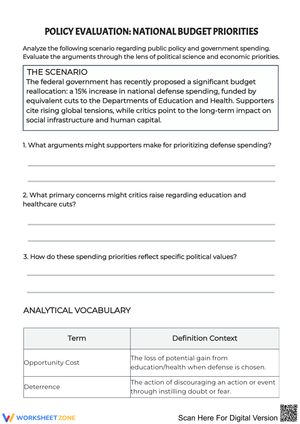
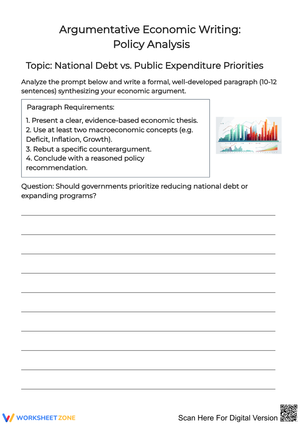
- Fiscal and monetary policy case studies — Short scenarios position students as policy analysts who must identify the economic problem, choose a policy response, and trace likely effects through the economy.
- Comparative advantage calculations — Data tables present two countries' production possibilities, and students calculate opportunity costs to determine which country holds the comparative advantage in each good.
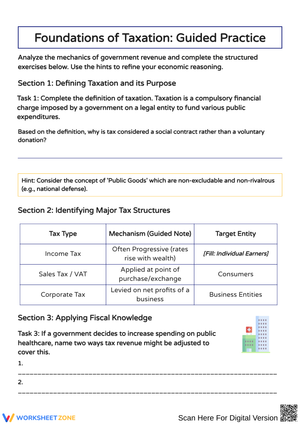
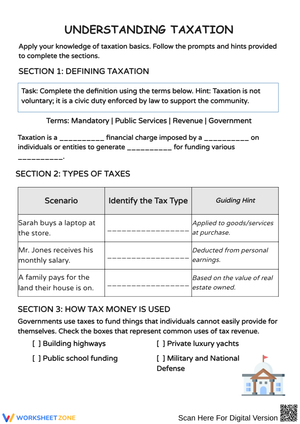
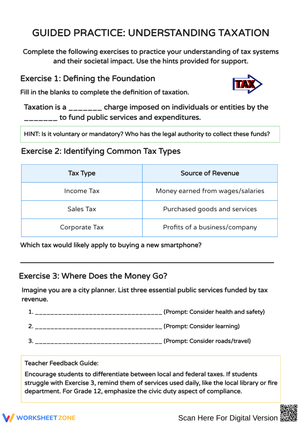
- Personal finance applications — Budgeting, compound interest, and credit cost exercises connect course content to financial decisions students will face within the next few years.
Mistakes Students Make That These Worksheets Help You Catch
Supply and demand graph errors follow a predictable pattern at this level. Students who can correctly state that rising consumer income increases demand for a normal good will still draw the demand curve shifting left — they understand the verbal relationship but haven't locked in the directional rule on the graph. The deeper confusion, though, is between a movement along a curve and a shift of the curve itself. When the price of a good changes, quantity demanded moves along an existing demand curve. When something other than price changes — income, consumer tastes, prices of related goods — the entire curve shifts position. Students conflate these routinely, and it surfaces not just on tests but in how they explain graph results in writing.
Fiscal and monetary policy is the other consistent trouble area. Many students mix up which institution controls which tool — attributing interest rate decisions to Congress or assigning government spending authority to the Federal Reserve. The case study worksheets force students to name the specific institution, identify the mechanism, and trace the effect through the economy, which catches this confusion during practice rather than on a summative exam.
Building These Into Your Lesson Sequence
Vocabulary and definition worksheets earn their place at the start of a new unit, used as a five-minute in-class activator rather than sent home as reading. Students who encounter terms like "elasticity" or "monetary transmission mechanism" in context immediately after seeing them on a worksheet retain definitions more reliably than students who read a glossary at home the night before. The activation matters — it primes retrieval before instruction rather than hoping for it after.
Graph analysis worksheets do their best work during guided practice. Walk through the first problem with the whole class, narrating your reasoning as you draw, label, and shift the curve. Then release students to complete the remaining problems independently. This gradual release approach works especially well with supply and demand exercises because students need to see the process modeled before they can replicate it — the graph is not intuitive the first time through. A short-answer prompt from a case study worksheet makes a reliable exit ticket: a single sentence predicting how a policy change will affect employment or output tells teachers more about student understanding than a multiple-choice score at the end of a lesson.
The economics worksheets printable for 10th grade in this set also pair naturally with news-driven discussions. The fiscal policy case studies work particularly well after students read a current article about a federal budget proposal, giving them a structured way to apply abstract concepts to something they just encountered outside the classroom.
Standard Alignment
These worksheets align with the C3 Framework for Social Studies State Standards, specifically the Economics disciplinary strand (D2.Eco.1–15 for grades 9–12), which spans market analysis, national economic performance, and global economic interdependence. The personal finance worksheets address standards adopted by many states under separate financial literacy mandates, including the Jump$tart Coalition's National Standards in K-12 Personal Finance Education.
Teachers working with the Council for Economic Education's Voluntary National Content Standards in Economics will find coverage distributed across Standards 2 (marginal cost-benefit analysis), 8 (role of prices in market systems), 14 (GDP measurement), 16 (unemployment and inflation), and 20 (fiscal and monetary policy instruments). Verify your state's scope and sequence to confirm where each worksheet fits within your specific course calendar.
Adjusting Each Worksheet for Different Readiness Levels
For students who need more support, the most effective adjustment to vocabulary and short-answer worksheets is adding a word bank. The economics content may not be beyond them, but producing the right term in writing is a separate cognitive task from understanding the concept, and removing that retrieval demand frees up working memory for the reasoning itself. On comparative advantage calculation worksheets, annotating the data table with a completed example for one country gives those students a reference point without eliminating the challenge of calculating the second country's opportunity cost on their own.
Students who finish early or need additional challenge respond well to extensions built from the case study and data interpretation worksheets. Ask them to construct a counter-argument against the conclusion they just wrote, add a second policy response to the scenario, or identify a real-world example where the data trend shown in the table broke down. These prompts do not require a separate worksheet — teachers can write them on the board or add them verbally. The economics worksheets printable for 10th grade in this set leave enough open space at the top end of each task to support this kind of extension without preparing a separate version in advance.
Frequently Asked Questions
Which worksheet types work best as quick formative checks rather than extended practice activities?
Short-answer case study prompts and data interpretation questions are the strongest formative tools in this set. They require students to produce reasoning in writing, which surfaces misconceptions more clearly than fill-in-the-blank or matching formats. A graph analysis worksheet used as a partner activity — with students required to write out their reasoning for each curve shift — also gives teachers useful diagnostic information before a unit test.
How much class time should teachers plan for completing each worksheet?
Vocabulary and matching exercises typically run 8–12 minutes for independent work at grade level. Graph analysis and case study worksheets take longer — usually 15–25 minutes — particularly when students are expected to write out their explanations. Factor this into a 50-minute lesson that also includes direct instruction and discussion, because running short on time means students rush the written responses, which is usually where the real learning shows up.
Can these worksheets support a one-semester course that combines micro and macro content?
Yes. Each worksheet addresses a single concept or skill, so teachers can select and sequence them to match whatever unit order their course follows. A combined semester draws from the micro content — opportunity cost, supply and demand, market structures — in the first half and the macro content — GDP, fiscal and monetary policy, international trade — in the second, with personal finance woven in where the course schedule allows.
Do these work for hybrid or fully online economics courses?
The economics worksheets printable for 10th grade come as print-ready PDFs, which makes them easy to assign through a learning management system as fillable documents or as tasks students complete by hand and photograph. Graph analysis exercises in particular benefit from students physically drawing and labeling curves — the act of plotting a shift on paper reinforces the concept in a way that selecting a pre-drawn answer choice digitally does not.