10th Grade Graphing Sine and Cosine Functions Worksheets
These 10th grade graphing sine and cosine functions worksheets give teachers a focused tool for one of the most visually demanding skills in the pre-calculus sequence — translating an equation like y = -3cos(2x + π) + 1 into an accurate, annotated graph. Students at this level have already worked with transformations on linear and quadratic functions, but sinusoidal graphs introduce horizontal compression in a way that consistently trips them up, and structured paper practice is where that confusion gets resolved.
The Graphing Skills These Worksheets Target
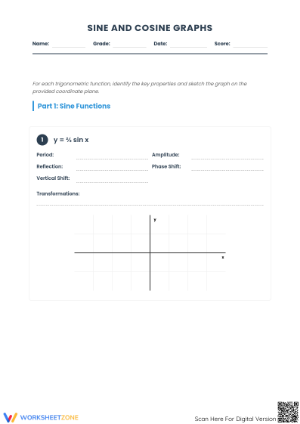
Trig graphing competence at this level is really about reading an equation layer by layer before the pencil touches the grid. Each worksheet walks students through the same set of parameters in sequence before any plotting begins:
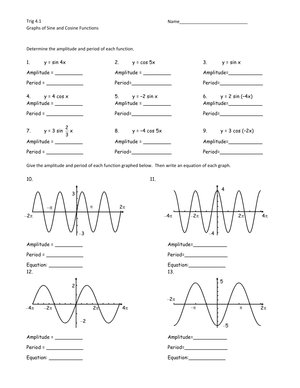
- Amplitude: vertical distance from the midline to a peak or trough — not from the x-axis, which matters as soon as a vertical shift appears
- Period: computed by dividing 2π by the horizontal scaling factor inside the argument, not read directly from the coefficient
- Midline: the horizontal baseline students draw first and anchor every key point to
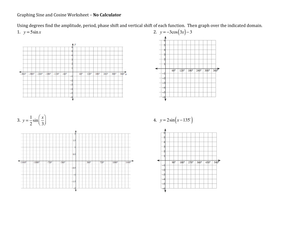
- Phase shift: requires factoring the expression inside the argument before the horizontal displacement can be read correctly
- Vertical shift: moves the midline up or down and is the source of most amplitude-confusion errors
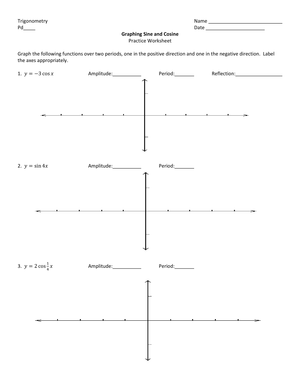
Phase shifts produce the most persistent confusion. A student who correctly computes the period of y = sin(2x - π) will often mark the horizontal shift as π, when the correct reading requires factoring first — y = sin(2(x - π/2)) — making the actual shift π/2, half of what they wrote. Worksheets that include a close-reading step before any plotting happens build the habit of working through the equation systematically rather than pattern-matching visually. The 10th grade graphing sine and cosine functions worksheets in this set require students to complete a features table — amplitude, period, phase shift, vertical shift, and midline — before the graphing grid even appears on the worksheet.
Student Errors That Surface Consistently in 10th Grade Trig
The errors students make on sinusoidal graphs are remarkably uniform from class to class. The most common: reading the coefficient of x as the period rather than as the factor used to compute it. A student sees y = cos(3x) and writes "period = 3" rather than "period = 2π/3." They are not confused about what period means in the abstract — they simply skip the division step that connects the equation to the number. Worksheets that require the computation explicitly, rather than leaving it implied, surface this gap every time.
A second persistent error is conflating the vertical shift with amplitude. When students graph y = 2sin(x) + 3, they frequently place peaks at y = 5 and troughs at y = 1 — which is numerically correct — but then describe the amplitude as 5 because they are measuring from the x-axis rather than from the midline at y = 3. Asking students to draw and label the midline before plotting any other point addresses this directly. A third recurring error is applying phase shifts in the wrong direction: seeing (x + π/6) and shifting right instead of left. Error-analysis tasks, where a wrong graph is presented and students must identify and correct the specific feature that was misread, give teachers more diagnostic information than a second round of straightforward graphing items.
Where These Worksheets Fit in the Instructional Week
The most productive placement is the transition between direct instruction and independent work — the 12 to 15 minutes after a teacher-led example when students are ready to try on their own but not yet ready for a blank problem. A guided worksheet that sequences the features table, then the key-points table, then the graph gives students a structure to follow without requiring the teacher at every step. A student who gets stuck on the phase shift can still complete the amplitude, midline, and most of the key points correctly.
Bell-ringer use works particularly well for single-transformation practice. A two-minute opener that asks students to identify amplitude and midline from one equation — no graphing — refreshes the vocabulary before the lesson moves to full transformed graphs. Mixed-review worksheets earn their place in the two days before a unit test, when students need to encounter parent graphs, stretched graphs, and fully transformed graphs in the same sitting. The 10th grade graphing sine and cosine functions worksheets in this set are organized so each one stands alone as a warm-up, a practice block, or an exit task — no particular order is required.
Why the Key-Point Method Works at This Grade Level
Tenth-grade students have enough graphing experience to sketch a rough curve from memory, which is actually a liability when transformations are involved. A student who "knows what sine looks like" will draw a confident but wrong graph of y = sin(2x - π) + 1 if they bypass the calculation step. The key-point method — computing the five anchor points that define one full cycle, then connecting them in the correct shape — forces a productive slowdown. It also makes errors correctable before they propagate into the graph: if a student's midline sits at y = 0 but the equation includes +1, the discrepancy appears in the features table, not after the entire curve is drawn.
Cognitive load theory supports separating the identification task from the graphing task. When students must simultaneously parse the equation, recall what each parameter does, decide on a scale, and place points accurately on a grid, the process collapses into guessing. Worksheets that isolate the identification step into its own table — completed before the grid is visible — reduce that demand and produce more accurate student work in less time than open-ended graphing tasks do.
Differentiating the Work Across Student Entry Points
For students who need additional support, pre-labeled midlines and a completed features table alongside a blank graph let them concentrate entirely on plotting key points in the right positions. Partially completed graphs — where the midline and one anchor point are already marked — preserve the graphing task while reducing the demands of starting from nothing. These students work on the same mathematical relationships; they simply have more of the setup provided.
On-level students complete the features table independently, plot five key points for one full cycle, and then tackle a second item that requires writing the equation from a given graph — reversing the process and demanding a different kind of reasoning. Extension tasks ask students to compare a sine and cosine model of the same periodic behavior, identify which equation better fits a described context like tidal height or alternating current, or interpret what a specific phase shift means in practical terms. The 10th grade graphing sine and cosine functions worksheets include items at each of these levels, so teachers can assign different worksheets within the same class period without building separate lesson plans.
Standard Alignment
These worksheets align to CCSS HSF-TF.A.4, which addresses graphing trigonometric functions including transformations, and to HSF-TF.B.5, which asks students to select trigonometric functions to model periodic phenomena with specified amplitude, frequency, and midline. In classroom terms, the modeling standard in HSF-TF.B.5 requires students to already produce accurate graphs — they need something reliable to analyze before they can choose a model. The graphing work in these worksheets is the direct prerequisite for that modeling work, not a separate drill. Teachers in states using standards derived from the Common Core framework will find these worksheets map cleanly onto the same strand.
Frequently Asked Questions
Should students work in radians or degrees with these worksheets?
These worksheets use radian measure, with x-axes labeled at multiples of π. The key points for one full cycle — 0, π/2, π, 3π/2, 2π — maintain consistent fractional relationships when the period changes, which makes the computation more transparent. When a student graphs y = sin(2x), they can immediately locate the compressed cycle endpoints at 0 and π by working with the formula directly. Degree-based graphing requires scaling 0° through 360° down to 0° through 180° for that same function, adding arithmetic overhead without adding conceptual clarity.
How do teachers handle students who can graph sine correctly but keep making errors on cosine?
This split appears in most classes. Students who anchor on the sine graph first sometimes treat cosine as a modified sine rather than a distinct parent function with its own starting shape. The cosine curve begins at its maximum — at (0, 1) for the unmodified function — while sine begins at the midline. A worksheet that places both parent curves side by side and asks students to label the starting point and direction of the first quarter-cycle for each makes the distinction concrete. After that comparison, cosine transformations follow exactly the same procedure as sine transformations; the only persistent difference is the starting key point of the cycle.
At what point in a unit is it appropriate to assign worksheets that mix all four transformations?
Amplitude and period are worth separating before they appear together, because students routinely confuse the two. Once students can produce both values reliably from an equation — not occasionally, but consistently — a combined worksheet is appropriate. Phase shift belongs after that, and vertical shift can typically be introduced alongside phase shift since the two operate on different axes and rarely compound each other's confusion. Full mixed-transformation worksheets belong at the end of the sequence, after each feature has been isolated and practiced, not in the middle as an introduction to complexity.
Clear All