




























Proven Work & Power Graphs Worksheet | Grades 8–12 Science
Paste this activity's link or code into your existing LMS (Google Classroom, Canvas, Teams, Schoology, Moodle, etc.).
Students can open and work on the activity right away, with no student login required.
You'll still be able to track student progress and results from your teacher account.
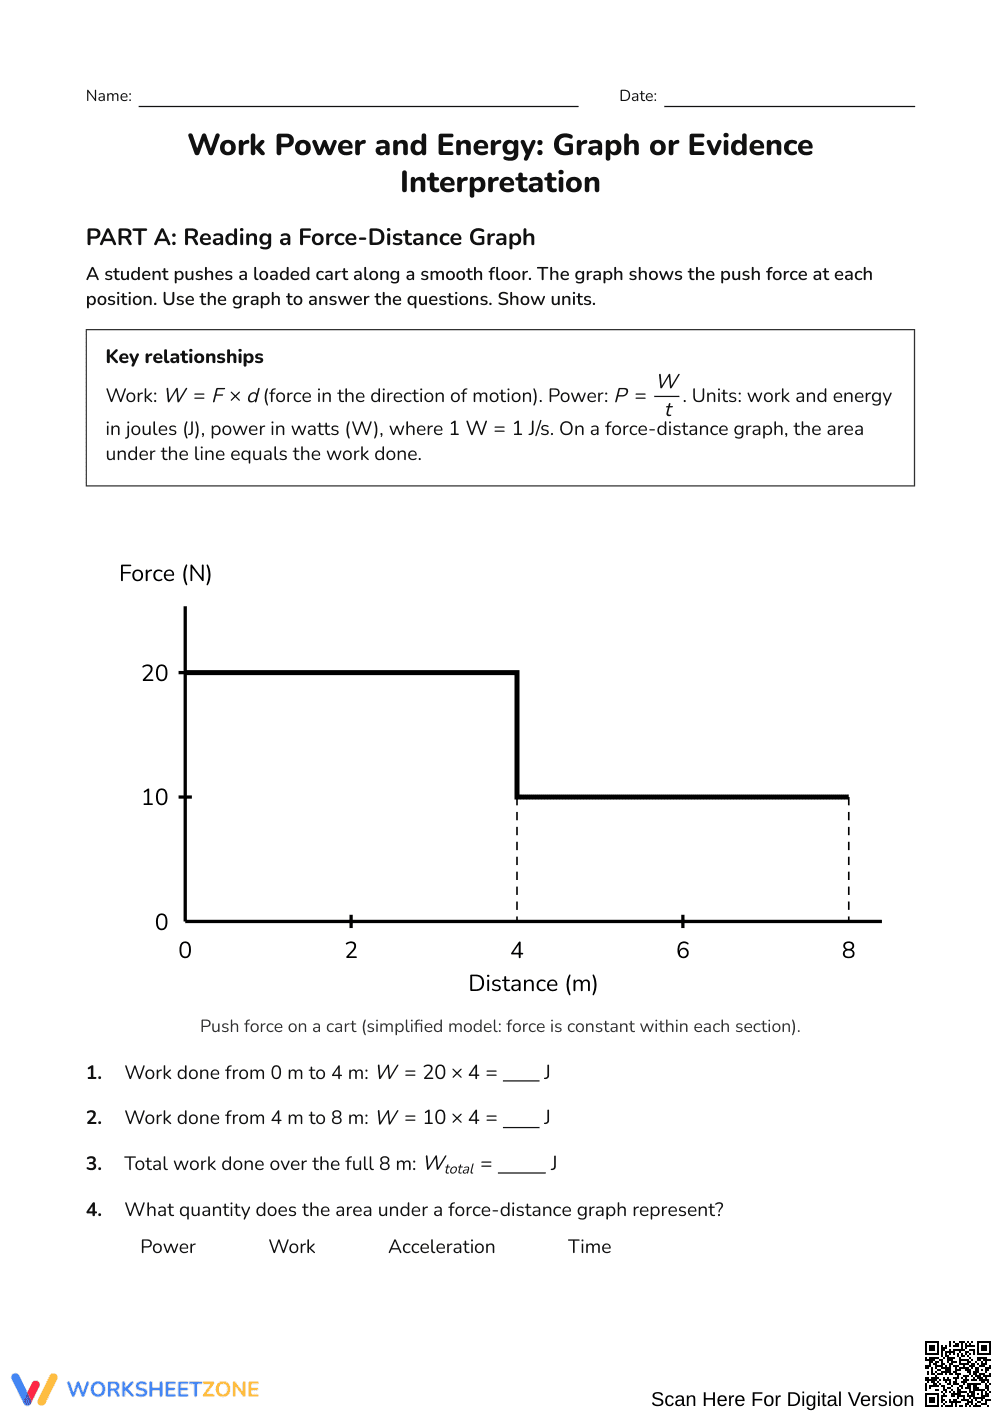
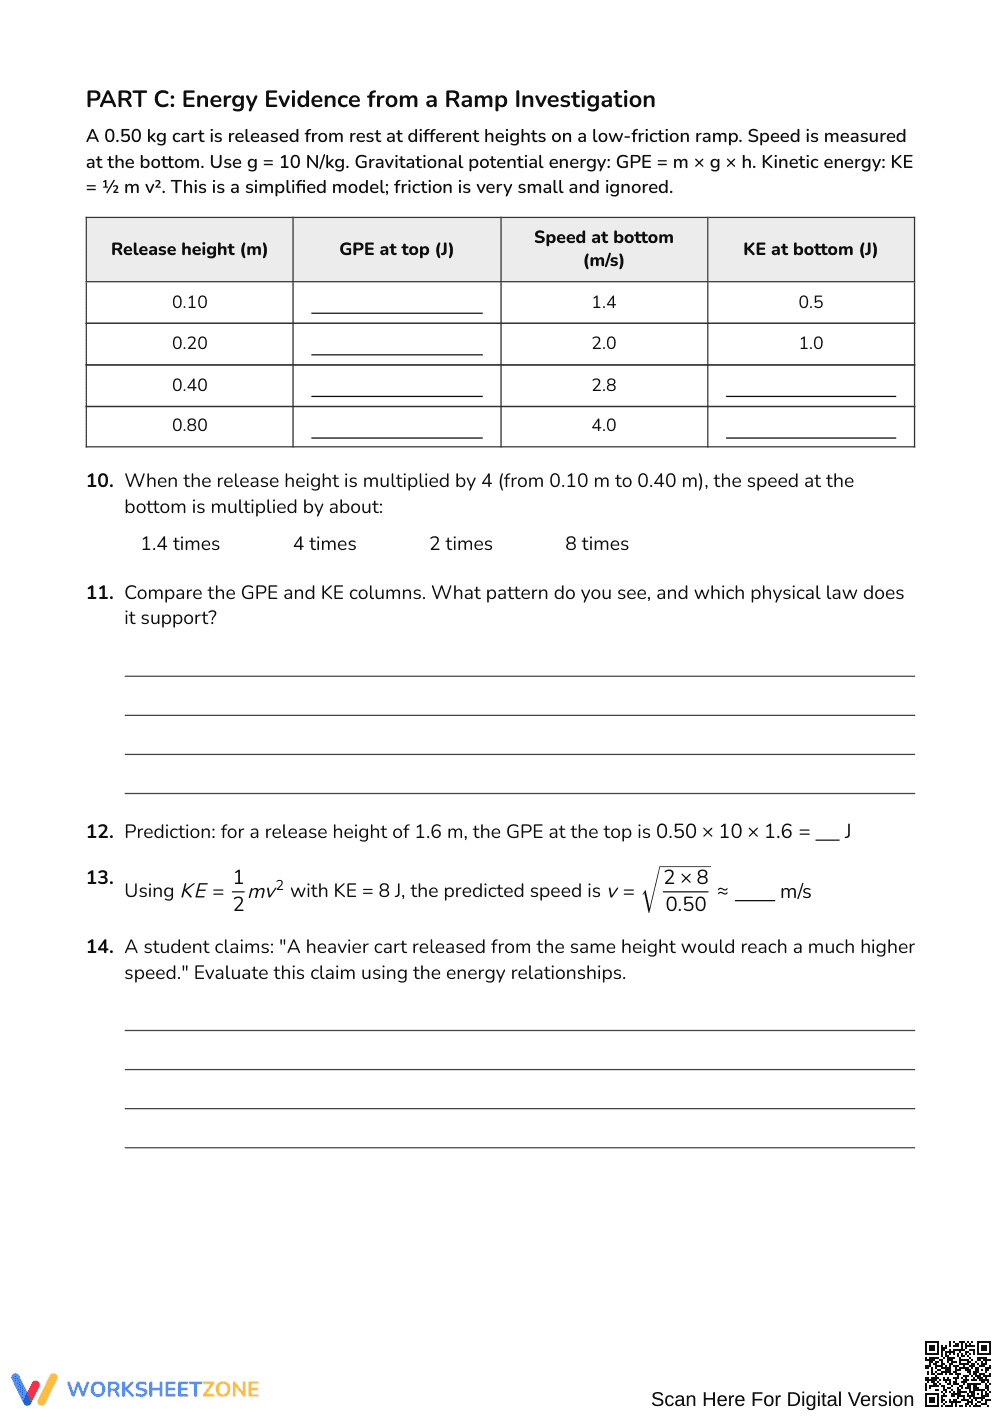
This physical science worksheet equips high school and middle school students to analyze force-distance graphs, compare work and power calculations, and interpret kinetic and potential energy evidence. Learners directly evaluate graphical areas, calculate rates of energy transfer, and verify the conservation of energy using empirical investigation data.
At a Glance
- Grade: Grades 8–12 · Subject: Science
- Standard: Interpret graphical representations and experimental data to calculate work, power, and energy transformations
- Skill Focus: Work, power, and energy graph interpretation
- Format: 4 pages · 27 problems · Answer key included · PDF
- Best For: High school physics practice or review
- Time: 45–60 minutes
This 4-page resource features 27 structured items organized into three investigation parts. Students analyze a force-distance push model, evaluate tabular lifting data, and analyze experimental ramp observations. Scaffolds include defined formula reference boxes, labeled worked examples for area calculations, and a comprehensive 4-page teacher answer key.
Skill Progression
- Guided practice (Part A): Students calculate work as area under a force-distance curve across 7 items, supported by worked segment steps and error-analysis models.
- Supported practice (Part B): Learners compare 10 multi-step work and power trials in structured data tables to distinguish energy magnitude from rate of transfer.
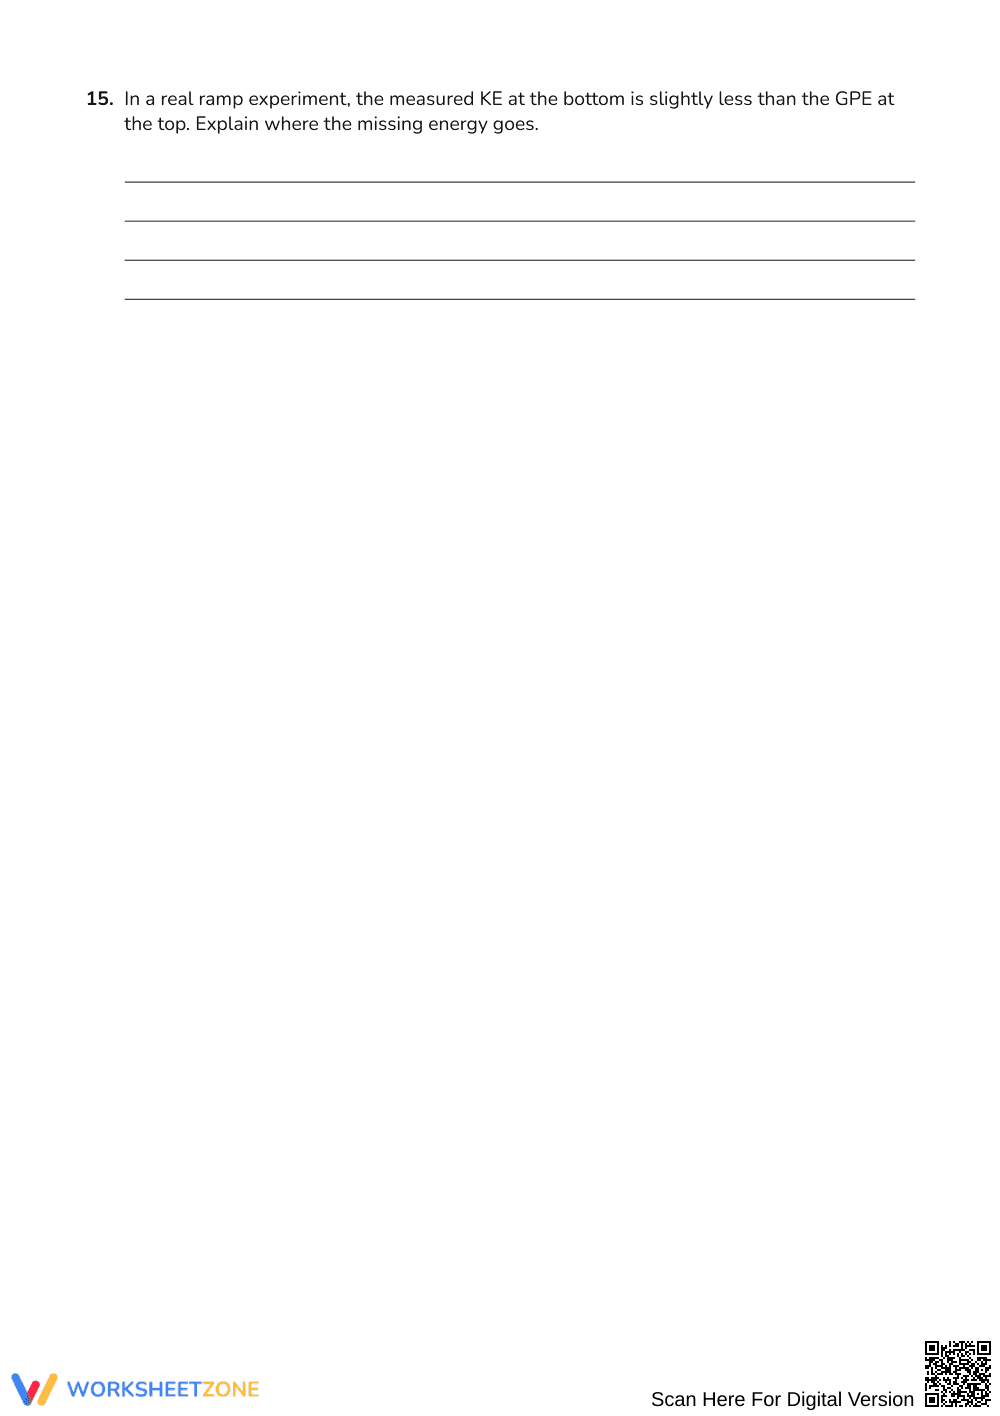
- Independent practice (Part C): Students interpret 10 data-driven ramp items, predicting velocities and using conservation of energy to explain real-world energy dissipation.
This sequence mirrors the gradual-release model, moving students from guided graphical interpretation to independent quantitative reasoning.
Standards Alignment
This activity aligns with middle and high school physical science performance expectations requiring students to construct, use, and present arguments supporting claims that energy is transferred or transformed. Students model relationships between force, displacement, kinetic energy, and potential energy. Both standard codes can be copied directly into lesson plans, IEP goals, or district curriculum mapping tools.
How to Use It
Deploy this worksheet after direct instruction on work and power equations. First, use Part A as partner practice to reinforce graph area concepts before students complete Parts B and C individually. Formatively observe whether students mistakenly multiply maximum force by total displacement rather than breaking piecewise graphs into distinct intervals. Allow 45 to 60 minutes for completion.
Who It's For
This practice is designed for introductory physics and physical science students in grades 8 through 12. Segmented tables and explicit formulas accommodate developing problem-solvers, while multi-step prediction tasks challenge advanced learners. Pair this worksheet directly with a cart-and-ramp lab activity or interactive motion simulation.
In secondary physical science instruction, interpreting graphical representations of work, power, and energy is essential for conceptual and quantitative mastery. Grounded in the instructional frameworks identified by Fisher & Frey (2014), structured progression from explicit graphical models to independent data interpretation reinforces cognitive transfer. This worksheet provides 27 targeted items requiring students to calculate work from force-distance curves, evaluate work and power rates across multiple lifting trials, and verify gravitational potential energy and kinetic energy conservation. By guiding students through piecewise area calculation and empirical velocity predictions, the resource addresses persistent misconceptions regarding mass independence in free motion and thermal energy dissipation. The scaffolded format supports diverse learners across grades 8 through 12 while demanding rigorous quantitative reasoning. Educators can reliably utilize this resource for formative assessment, laboratory synthesis, or mastery verification in any standard physical science curriculum.


