
























Proven Text & Graphic Claims Worksheet | Grade 9 English I
Paste this activity's link or code into your existing LMS (Google Classroom, Canvas, Teams, Schoology, Moodle, etc.).
Students can open and work on the activity right away, with no student login required.
You'll still be able to track student progress and results from your teacher account.
This Grade 9 English I worksheet trains students to synthesize quantitative charts and qualitative informational passages. Working with a case study on youth center attendance, high schoolers evaluate data sets, identify correlations, qualify claims, and reconcile conflicting textual and graphical evidence.
At a Glance
- Grade: 9 · Subject: English I
- Standard:
RH.9-10.7— Integrate quantitative data with qualitative text analysis- Skill Focus: Defend a Text-and-Graphic Conclusion
- Format: 6 pages · 8 problems · Answer key included · PDF
- Best For: Informational synthesis and data analysis
- Time: 45–60 minutes
What's Inside
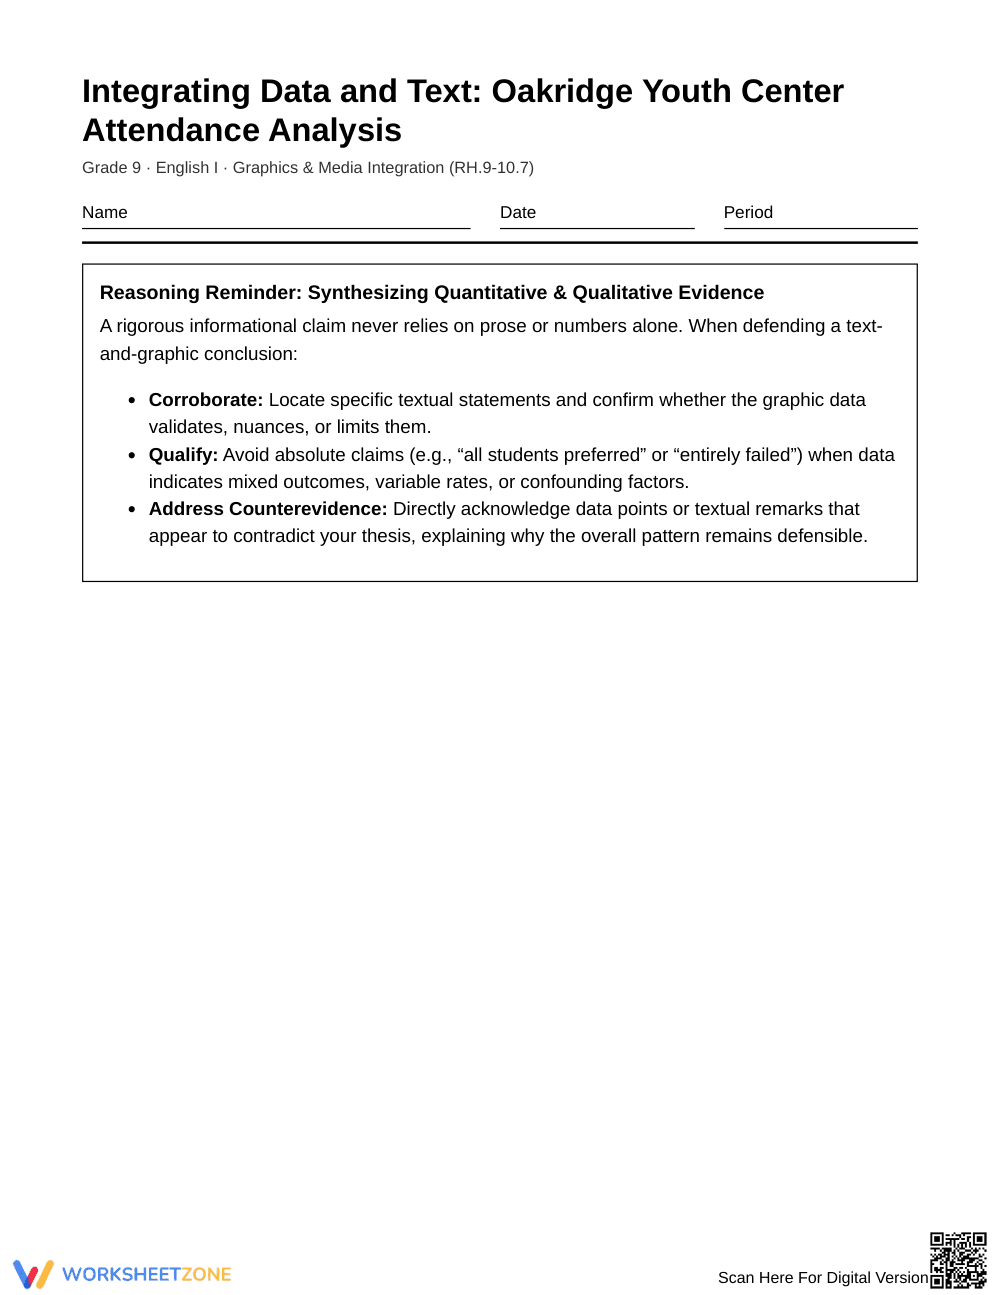
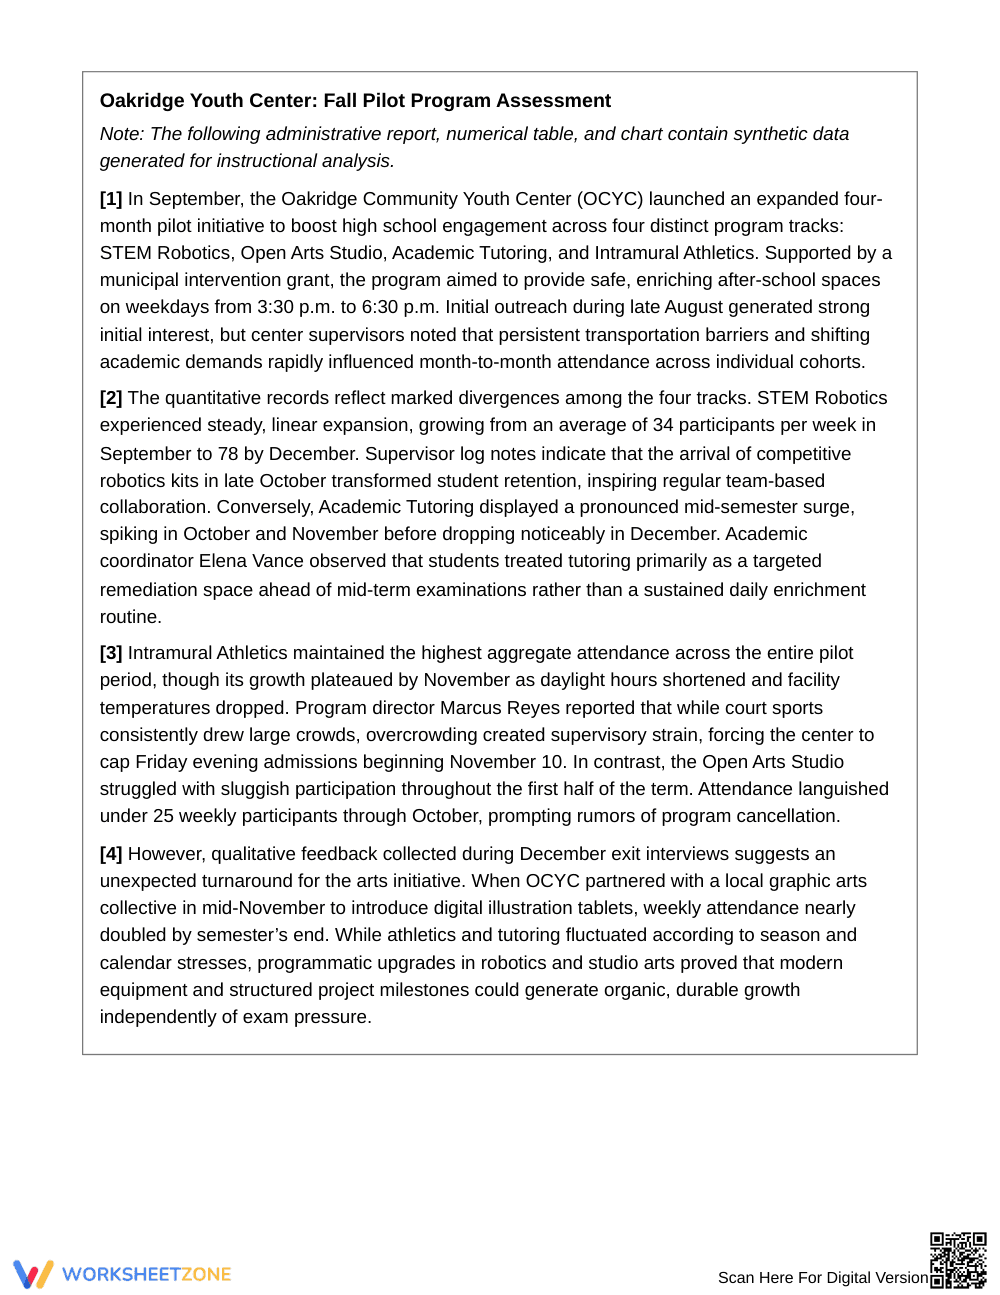
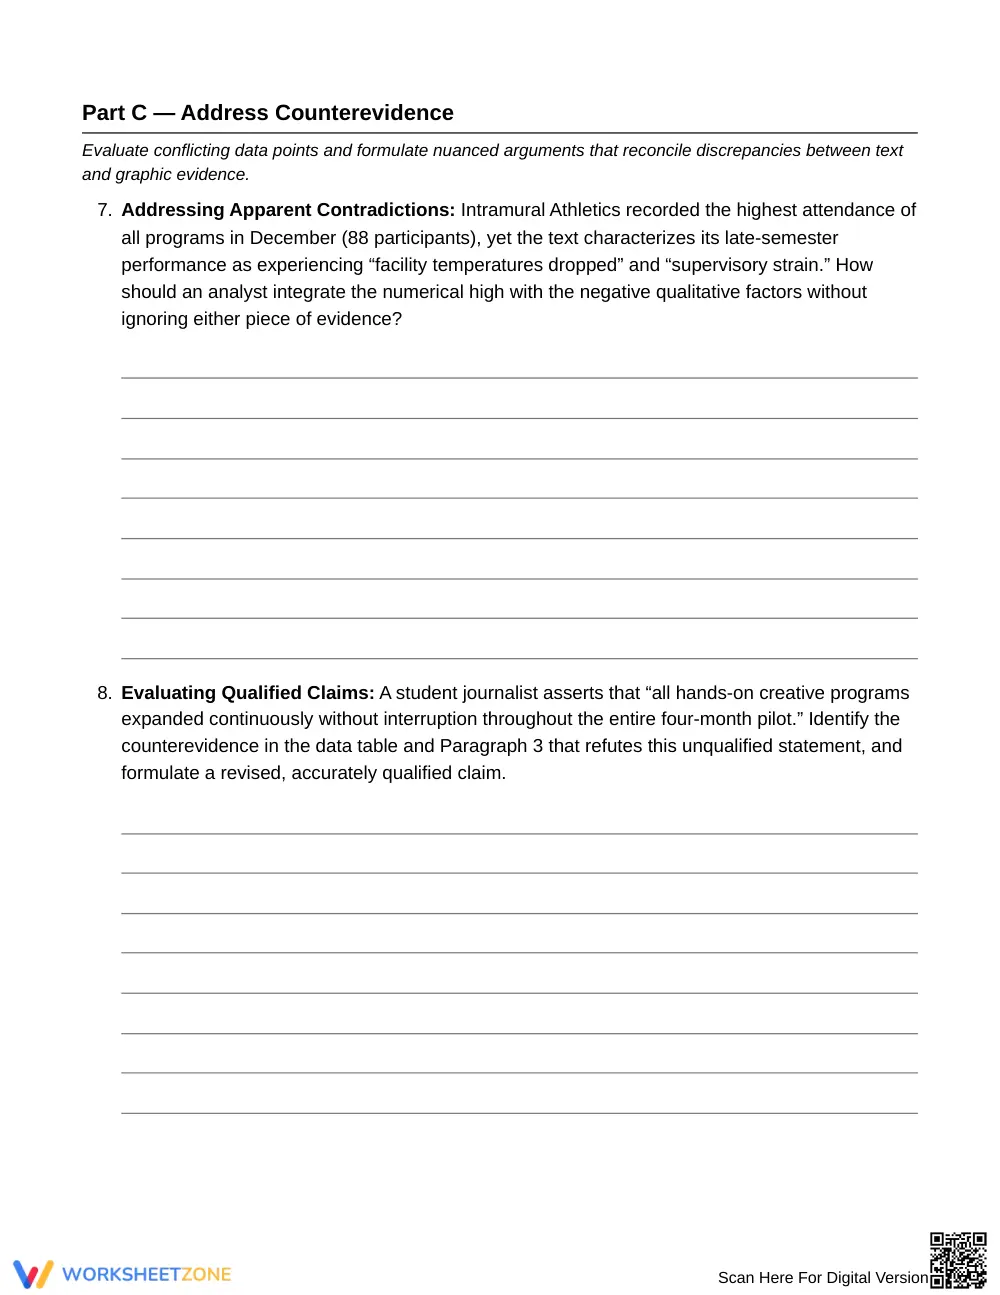
The 6-page packet features an informational report, data table, and multi-track line graph. Students complete 8 text-dependent synthesis questions across three analytical parts, supported by a strategy box and a complete 3-page answer key.
Skill Progression
- Guided practice (Part A — 2 tasks): Students identify direct data points from the table and correlate them with administrative observations.
- Supported practice (Part B — 4 tasks): Students synthesize multi-month metrics with staff feedback to defend nuanced counter-interpretations.
- Independent practice (Part C — 2 tasks): Students evaluate conflicting data points to formulate qualified arguments reconciling evidence.
This progression follows the gradual release model from basic evidence matching to nuanced multi-source argumentation.
Standards Alignment
This worksheet aligns to primary standard RH.9-10.7: "Integrate quantitative or technical analysis with qualitative analysis in print or digital text." It also supports CCSS.ELA-LITERACY.RI.9-10.1 by requiring students to cite strong evidence. Both standard codes can be copied directly into lesson plans, IEP goals, or district curriculum mapping tools.
How to Use It
Assign this worksheet after direct instruction on data integration or during an informational text unit. Have students annotate both the table and graph before answering Part B. For formative assessment, check whether students qualify claims in Part C rather than making generalizations. Expected completion time is 45 to 60 minutes.
Who It's For
This resource is designed for Grade 9 English I students and advanced Grade 8 learners. Pair it with an anchor chart on qualifying vocabulary (such as partially or diverged) to support English language learners.
Integrating informational text with quantitative graphics is essential for developing disciplinary literacy in secondary education. According to research highlighted by Fisher & Frey (2014), explicit instruction in synthesizing multimodal texts significantly improves students' capacity to construct evidence-based arguments and critically evaluate conflicting informational sources. Standard RH.9-10.7 tasks ninth-grade learners with integrating quantitative or technical analysis with qualitative text, moving beyond surface-level reading toward rigorous, evidence-driven critical inquiry. When high school students evaluate numerical data tables alongside administrative reports, they learn to interrogate discrepancies, isolate confounding variables, and avoid unearned absolute statements. Structured practice across 8 scaffolded synthesis problems allows learners to bridge discrete reading comprehension skills with authentic, real-world data evaluation. This gradual release framework equips adolescent readers to substantiate complex claims, interpret graphic representations with precision, and communicate defensible academic conclusions across diverse content areas.


